Figures & data
Figure 1 Summary of common electroanalytical methods.
Note: The units of measurement are given in parentheses (I, current; E, potential; R, resistance; G, conductance; Q, quantity of charge; t, time; vol, volume of standard solution; wt, weight of the electrodeposited species).
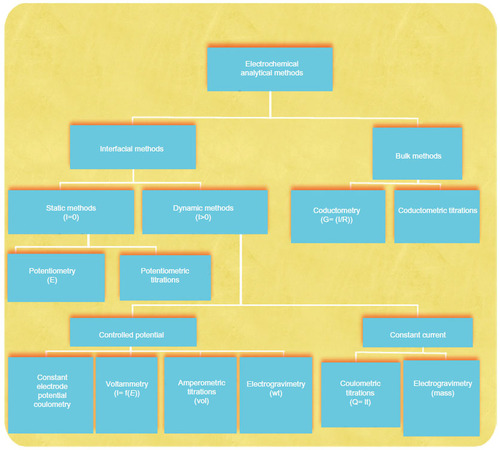
Figure 2 Charge distribution across the solid/liquid interface of a biosensor.
Notes: The drop in potential across the interface is shown in the graph. C+ and C− and φ(x) show the capacitance changes at the interface and the resultant bias potential formed due to the charge distribution at the interface. Changes in capacitance and voltage can be used to detect binding of biomolecules.
Abbreviations: OHP, outer Helmholtz plane; IHP, inner Helmholtz plane; PBS, phosphate-buffered saline; Ld, distance of separation between plates of a capacitor.
Abbreviations: OHP, outer Helmholtz plane; IHP, inner Helmholtz plane; PBS, phosphate-buffered saline; Ld, distance of separation between plates of a capacitor.
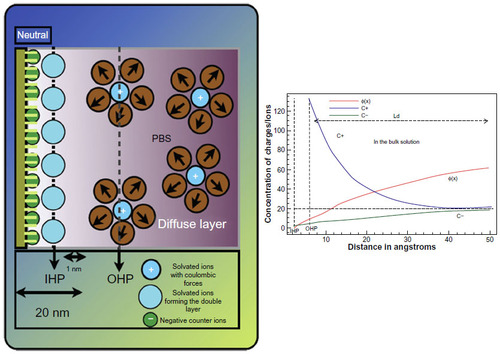
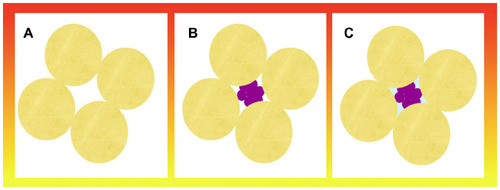
Figure 3 Illustration of the molecular crowding theory.
Notes: Molecular crowding has been more accurately determined by some researchers as “the excluded volume effect” because of its most basic characteristic of preventing movement of molecules. To illustrate this, consider a solution containing randomly close-packed ball bearings, which occupy about 65% of the volume of the unit space, leaving about 35% by volume in the interstices between the ball bearings. Even though this volume is empty, it is not possible to add even a single additional ball bearing of the same size. In other words, the volume available for the ball bearing has become zero, ie, total volume minus the excluded volume has effectively become zero (A). These spaces can be filled with smaller particles and this in itself would leave smaller gaps which can be filled with much smaller particles such as water molecules (B and C).