Figures & data
Table 1 Background characteristics of households
Figure 1 Occupational status of HH members.
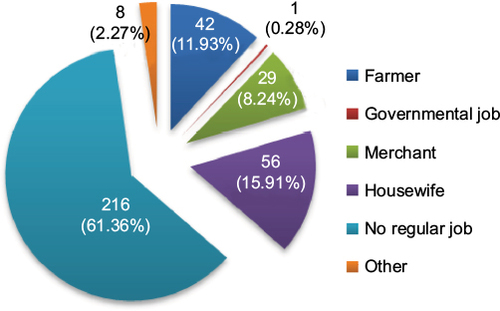
Figure 2 Age distribution and sex composition of the children included in the study.

Figure 3 List and frequency of prevailing homemade complementary foods served.
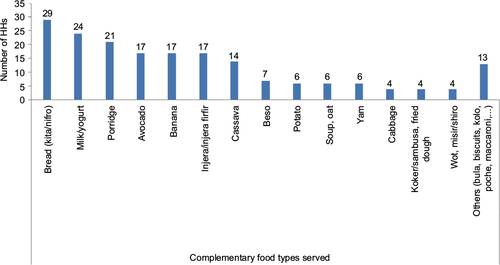
Table 2 Homemade complementary foods frequently observed
Figure 4 Top ten frequently used food items for complementary foods preparation.
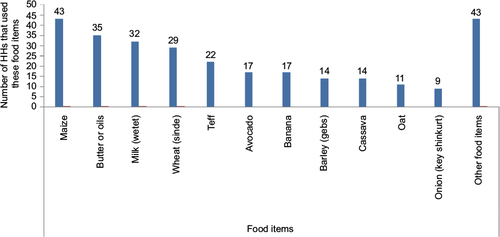
Table 3 Inclusion of various food categories to prepare complementary foods
Figure 5 Number of food categories used to prepare complementary foods.
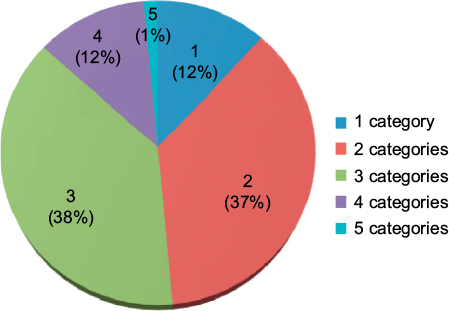
Table 4 Average number of food categories used by sex and age category of the children
Table 5 Energy, nutrient, and antinutrient contents (per 100 g as EP) of homemade complementary foods
Figure 6 Relationship between the moisture level and energy density.
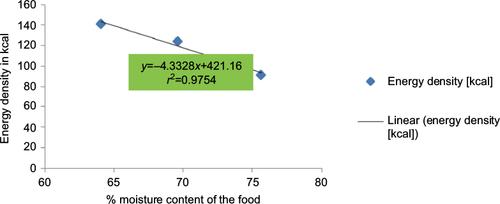
Table 6 Comparison of observed nutrient density to desired levels in complementary foods by age of the children
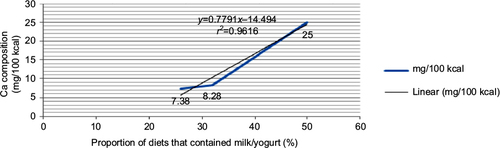
Figure 7 Difference in the Ca level among the diets of children of different age groups explained by the consumption of milk/yogurt.