
Figures & data
Figure 1 Flow diagram of 40 subjects who enrolled in a 30-day study and were randomized into one of the four 10-subject groups.
Notes: “A” is the subgroup that took active product (p-synephrine) for 30 days; “B” is the subgroup that took placebo for 30 days; “A/B” is the subgroup that took active product for 15 days followed by 15 days of taking a placebo; and “B/A” is the subgroup that took placebo for 15 days followed by 15 days of taking the active product.
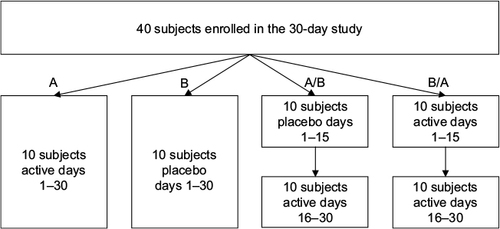
Figure 2 Weight Control Support Scale.
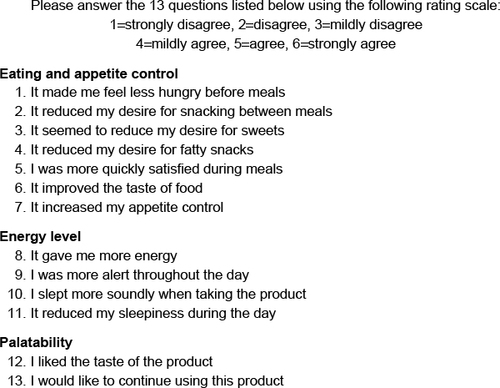
Table 1 ANOVA – groups A, B, A/B, and B/A.
Table 2 Results by question
Table 3 Summary of ANOVA by question