Figures & data
Table 1 Profile of Participants Enrolled in This Study
Figure 1 Trial participant tracking flowchart.
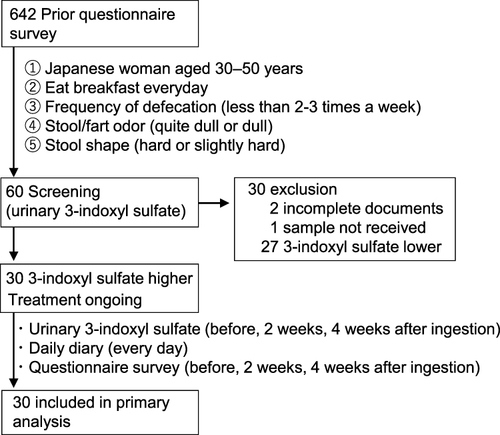
Figure 2 Changes in urinary 3-indoxyl sulfate levels.
Abbreviation: Cr, creatinine.
Notes: (A) Change with time from start of ingestion of the test article (n = 30). Statistical significance was determined using paired t-tests with Bonferroni correction coefficient. Significant differences from the initial values: **p < 0.01. Error bars indicate standard error. (B) Relationship between the initial urinary 3-indoxyl sulfate levels and the amount of change. Pearson’s correlation coefficient was 0.7407 (p < 0.001).
Notes: (A) Change with time from start of ingestion of the test article (n = 30). Statistical significance was determined using paired t-tests with Bonferroni correction coefficient. Significant differences from the initial values: **p < 0.01. Error bars indicate standard error. (B) Relationship between the initial urinary 3-indoxyl sulfate levels and the amount of change. Pearson’s correlation coefficient was 0.7407 (p < 0.001).
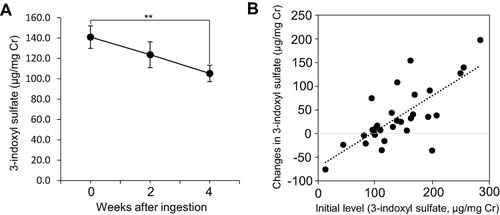
Table 2 Hierarchical Analysis of Changes in 3-Indoxyl Sulfate Values from the Initial 3-Indoxyl Sulfate Values
Figure 3 Changes in the constipation assessment scale and self-assessment of physical condition.
Abbreviation: CAS, Constipation Assessment Scale.
Notes: (A) CAS score. (B) Physical condition score. The score range is 0–24 points for the CAS and 0–30 points for the physical condition score, with lower scores being better. Statistical significance was determined using the Wilcoxon signed-rank test with Bonferroni correction coefficient. Significant differences from the initial values: *p < 0.05, **p < 0.01, ***p < 0.001. n = 30.
Notes: (A) CAS score. (B) Physical condition score. The score range is 0–24 points for the CAS and 0–30 points for the physical condition score, with lower scores being better. Statistical significance was determined using the Wilcoxon signed-rank test with Bonferroni correction coefficient. Significant differences from the initial values: *p < 0.05, **p < 0.01, ***p < 0.001. n = 30.
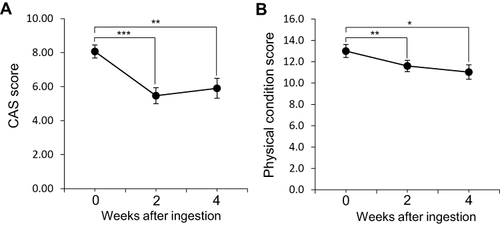
Table 3 Changes in the Number of Defecations, Stool Volume, and Stool or Flatulence Odor During the Test Period
Table 4 Changes in Each Items of Phisical Condition During the Test Period
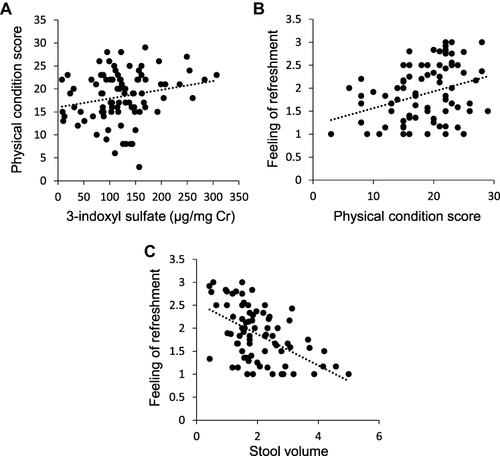
Figure 4 Correlation plot of several test parameters.
Abbreviations: Cr, creatinine; CAS, Constipation Assessment Scale.
Notes: (A) Urinary 3-indoxyl sulfate versus self-assessment of physical condition, including CAS. Pearson’s correlation coefficient was 0.2135 (p = 0.043). (B) Self-assessment of physical condition within the CAS vs the feeling of refreshment during defecation. Spearman’s rank correlation was 0.3120 (p = 0.003). (C) Stool volume (single defecation) vs the feeling of refreshment during defecation. Spearman’s rank correlation coefficient was 0.5193 (p = 0.001).
Notes: (A) Urinary 3-indoxyl sulfate versus self-assessment of physical condition, including CAS. Pearson’s correlation coefficient was 0.2135 (p = 0.043). (B) Self-assessment of physical condition within the CAS vs the feeling of refreshment during defecation. Spearman’s rank correlation was 0.3120 (p = 0.003). (C) Stool volume (single defecation) vs the feeling of refreshment during defecation. Spearman’s rank correlation coefficient was 0.5193 (p = 0.001).