
Figures & data
Figure 1 Flow chart of the subjects’ recruitment process.
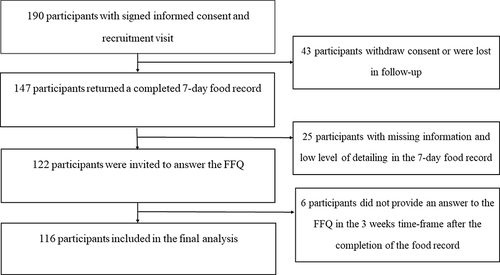
Table 1 Characteristics of Study Participants by Sex (N=116)
Table 2 Unadjusted and Adjusted Intakes of Energy and Nutrient Intakes from the 7-Day Food Records and 4-Week Retrospective FFQ (n = 116)
Table 3 Adjusted and Unadjusted Spearman’s rho, Percentage of Participants Classified into the Same, Adjacent or Opposite Quartile by the 7-Day Food Records and 4-Week Retrospective FFQ and the Cohen’s Kappa (n = 116)
Figure 2 Bland–Altman plot with the difference in energy and nutrient intakes measured with the 7-day food records and 4 weeks retrospective FFQ plotted against the mean intakes from the two methods. (A) energy intake (kcal); (B) protein intake (g); (C) fat intake (g); (D) carbohydrate intake (g).
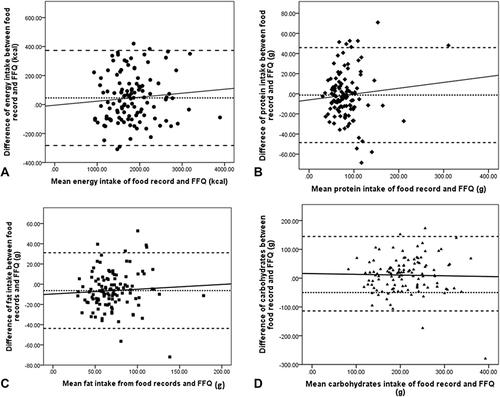
Figure 3 Bland–Altman plots for the difference in fractions of fatty acid intakes measured with the 7-day food records and 4 weeks retrospective FFQ, plotted against the mean intakes from the two methods. (A) SFA intake (g); (B) PUFA intake (g); (C) MUFA intake (g); (D) total sugars intake (g).
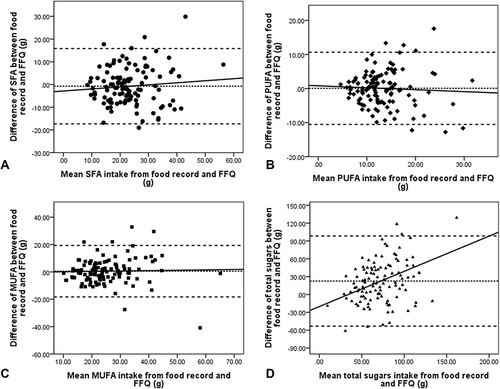
Table 4 Intakes of the Food Groups as Assessed by 4-Week Retrospective FFQ and 7-Day Food Records Methods (n = 116)
Table 5 Spearman’s rho, Percentage of Participants Classified into the Same, Adjacent or Opposite Quartile by the 7-Day Fooc Records and 4-Week Retrospective FFQ and Cohen’s Kappa (n = 116)