
Figures & data
Table 1 Nutrient composition of the supplementary foods per 100 g
Figure 1 Schematic presentation of enrollment and completion of study by participants.
Abbreviations: CSB+, corn soy blend plus; SPB, sorghum peanut blend.
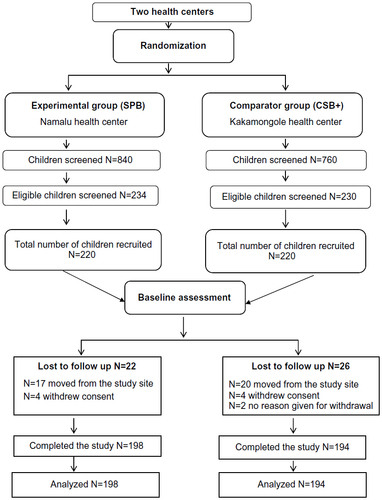
Table 2 Baseline comparison of the key demographic characteristics, household food security status, and health indicators of the study groups
Table 3 Baseline anthropometric characteristics of study children
Table 4 Impact of the interventions
Figure 2 A comparison of survival experiences of children on the two food supplements.
Abbreviations: CSB+, corn soy blend plus; SPB, sorghum peanut blend.
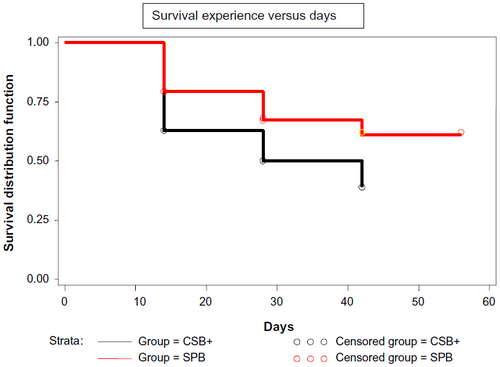
Table 5 Predictors of recovery time