Figures & data
Table 1 PANSS and PANSS subscale rates (points) in patients subtype with positive symptoms and in patients subtype with negative symptoms (Mann–Whitney U test)
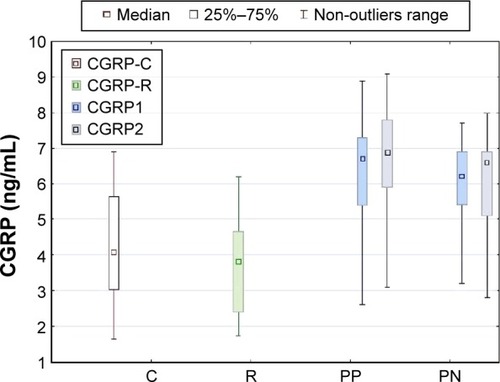
Figure 1 Comparison of beta-endorphin concentrations in patients with positive symptoms (PP), and patients with negative symptoms (PN) before treatment (β-end1) and in stable mental state after treatment (β-end2) with controls (C, β-end-C) and first-degree relatives (R, β-end-R).
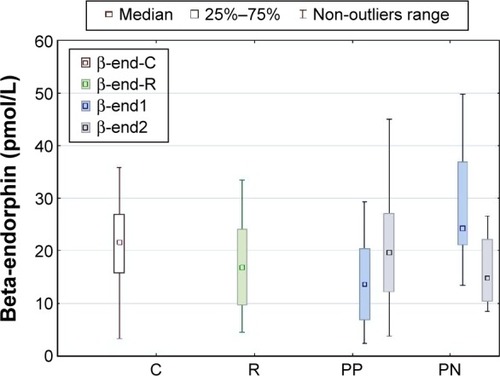
Figure 2 Comparison of CGRP concentrations in patients with positive symptoms (PP), and patients with negative symptoms (PN) before treatment (CGRP1) and in stable mental state after treatment (CGRP2) with controls (C, CGRP-C) and first-degree relatives (R, CGRP-R).
Abbreviation: CGRP, calcitonin gene-related peptide.