
Figures & data
Table 1 Demographic data
Figure 1 Forest plot showing comparison between Spanish scores and UK referential data.
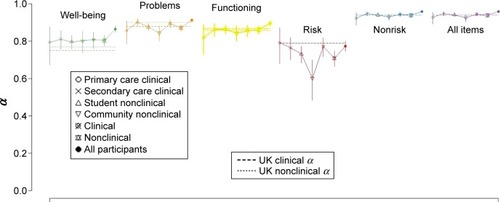
Table 2 Coefficient α (95% CI) denoting internal consistency for nonclinical and clinical samples
Table 3 Test–retest stability and changes of mean values between first and second survey in a nonclinical sample (n=78)
Table 4 Correlations with referential measures in clinical samples
Table 5 Mean and standard deviations for clinical and nonclinical samples
Figure 2 Box plot of mean item score for all items for clinical and nonclinical samples.
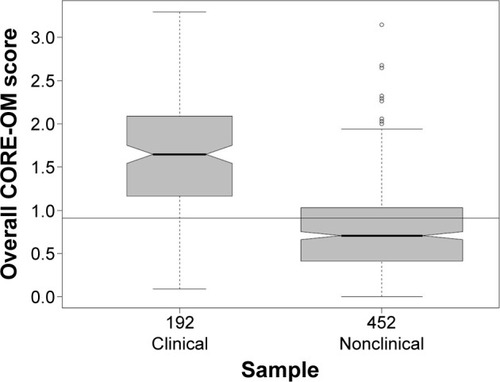
Table 6 Sex differences in scores for clinical and nonclinical samples
Table 7 Correlations between Spearman’s ρ values for clinical and nonclinical samples
Table 8 Male and female cutoff scores between clinical and nonclinical populations