
Figures & data
Figure 1 The mean MADRS total scores by visit.
Abbreviation: MADRS, Montgomery–Asberg Depression Rating Scale.
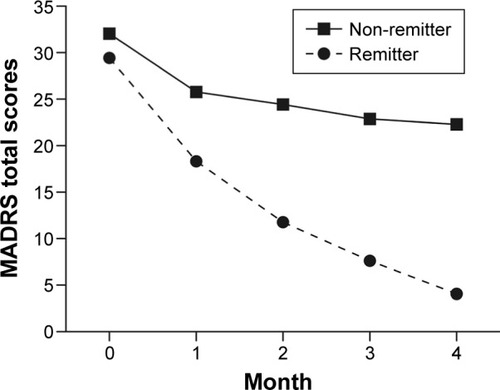
Figure 2 The mean MADRS subscale scores by visit.
Abbreviation: MADRS, Montgomery–Asberg Depression Rating Scale.
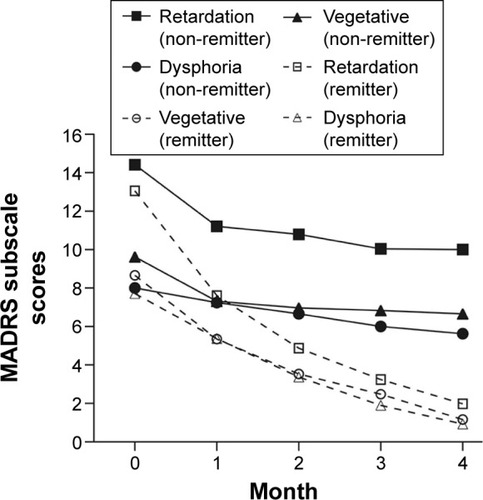
Table 1 Demographic, clinical, and treatment characteristics of patients
Table 2 Association between improvements at week 4 in each MADRS scores and subsequent remission
Table 3 Odds ratios estimated from multivariate logistic regression models of remission classification