Figures & data
Table 1 Demographic information and clinical measures for Stra and HCs
Figure 1 Significant differences in ReHo values between the Stra group and HCs.
Notes: The brain regions with different ReHo values are the RITC/RFG/RCAL (A), RLG (B), and BCG (C). The red areas denote higher ReHo brain regions. Multiple comparisons were performed using Gaussian random field theory (z >2.3, clusterwise P<0.05 corrected). T-values indicates the results of independent t-tests comparing the two groups in ReHo values in different brain regions.
Abbreviations: BCG, bilateral cingulate gyrus; HCs, healthy controls; RCAL, right cerebellum anterior lobe; ReHo, regional homogeneity; RFG, right fusiform gyrus; RITC, right inferior temporal cortex; RLG, right lingual gyrus; Stra, strabismus.
Abbreviations: BCG, bilateral cingulate gyrus; HCs, healthy controls; RCAL, right cerebellum anterior lobe; ReHo, regional homogeneity; RFG, right fusiform gyrus; RITC, right inferior temporal cortex; RLG, right lingual gyrus; Stra, strabismus.
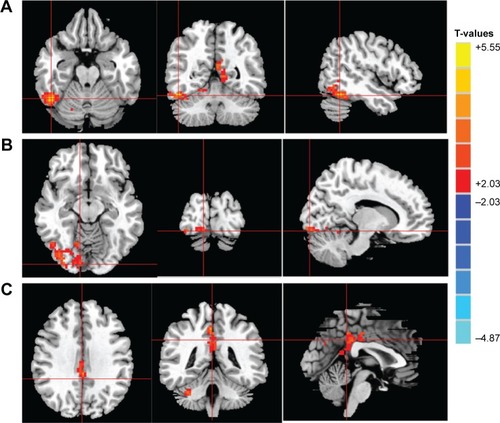
Figure 2 Mean of altered ReHo values between the Stra group and HCs.
Abbreviations: BCG, bilateral cingulate gyrus; HCs, healthy controls; RCAL, right cerebellum anterior lobe; ReHo, regional homogeneity; RFG, right fusiform gyrus; RITC, right inferior temporal cortex; RLG, right lingual gyrus; Stra, strabismus.
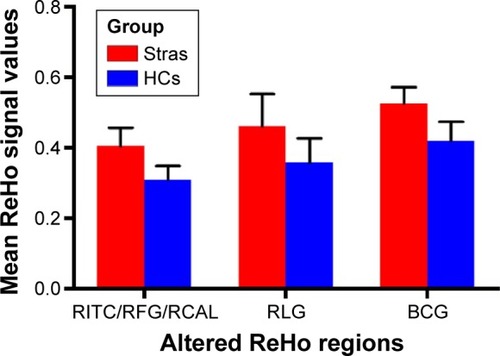
Table 2 Brain regions with significantly different ReHo values between the Stra and HCs
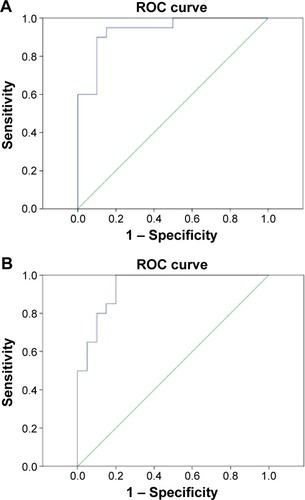
Figure 3 ROC curve analysis of the mean ReHo signal values for altered brain regions.
Notes: The area under the ROC curve was 0.938 (P<0.001; 95% CI: 0.864–1) for the RITC/RFG/RCAL (A), and 0.940 (P<0.001; 95% CI 0.870–1) for the BCG (B).
Abbreviations: BCG, bilateral cingulate gyrus; CI, confidence interval; RCAL, right cerebellum anterior lobe; ReHo, regional homogeneity; RFG, right fusiform gyrus; RITC, right inferior temporal cortex; ROC, receiver operating characteristic.
Abbreviations: BCG, bilateral cingulate gyrus; CI, confidence interval; RCAL, right cerebellum anterior lobe; ReHo, regional homogeneity; RFG, right fusiform gyrus; RITC, right inferior temporal cortex; ROC, receiver operating characteristic.