Figures & data
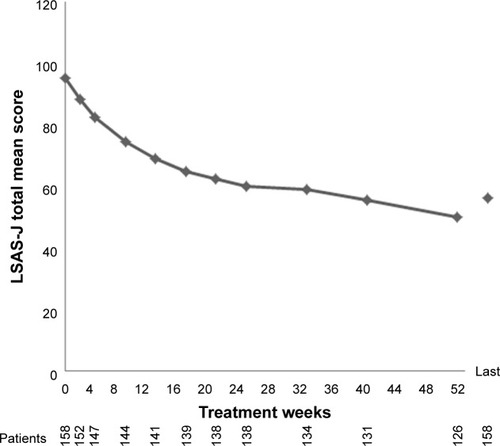
Figure 1 Flow chart of patient disposition.
Note:
aMultiple answers may be given for reason for withdrawal.
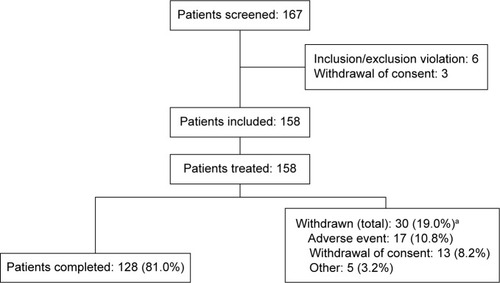
Table 1 Demographic and other baseline characteristics (APTS, n=158)
Table 2 Adverse drug reactions by period of onset (incidence of ≥2% in treatment period)
Table 3 Summary of efficacy evaluation (FAS)
Figure 2 Estimated change in the Japanese version of the LSAS-J total scores from baseline to week 52 (FAS, OC by visit) and FAS, LOCF at last assessment.
Note: Patient numbers at each visit are shown below the x-axis.
Abbreviations: FAS, full-analysis set; LOCF, last observation carried forward; LSAS-J, Liebowitz Social Anxiety Scale – Japanese Version; OC, observed cases.
Abbreviations: FAS, full-analysis set; LOCF, last observation carried forward; LSAS-J, Liebowitz Social Anxiety Scale – Japanese Version; OC, observed cases.