Figures & data
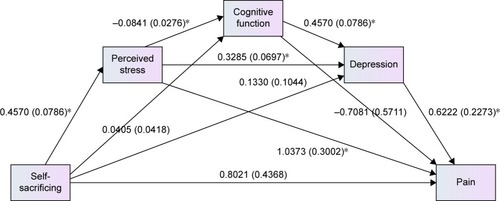
Figure 1 Path diagram illustrating the direct effects and causal paths linking depression–pain symptoms.
Notes:
a1, a2, a3, b1, b2, b3, c′ = path coefficient (unstandardized coefficient). The model fit statistics was chi-square =32.292, df=3, P<0.0001, chi-square/df=10.76; comparative fit index =0.941, root mean square error approximation =0.168, and standardized root mean square residual =0.0350.
Abbreviations: df, degrees of freedom; SMM, serial multiple mediation.
Abbreviations: df, degrees of freedom; SMM, serial multiple mediation.
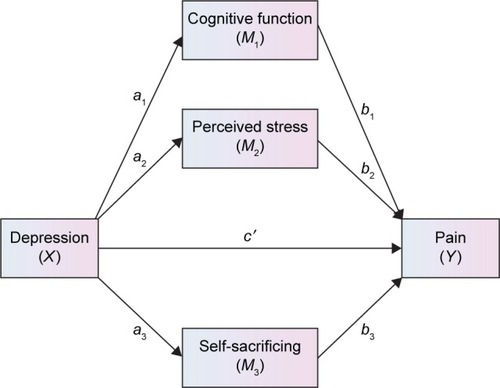
Table 1 Participants’ characteristics
Table 2 Path coefficients, indirect effects, and 95% bias-corrected confidence interval predicting pain symptom scores (N=346)Table Footnotea
Table 3 Possible serial models, according to different causal orders
Table 4 Causal chain according to models (X → M1 → M2 → M3 → Y)
Figure 2 Path diagram illustrating direct effects and causal paths linking depression with pain symptoms (SMM 3).
Notes: Values outside parentheses = path coefficient or unstandardized coefficient; values in parentheses = standard error, *P<0.001. The model fit statistics were as follows: chi-square =1.300, df=1, chi-square/df=1.3, P=0.254; comparative fit index =0.999, and root mean square error approximation =0.029.
Abbreviations: df, degrees of freedom; SMM, serial multiple mediation.
Abbreviations: df, degrees of freedom; SMM, serial multiple mediation.
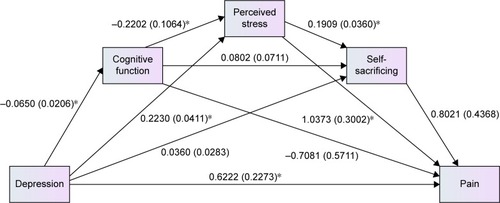
Figure 3 An alternative serial mediation model proposing how self-sacrificing predicts pain.
Notes: Values outside parentheses = path coefficient or unstandardized coefficient; values in parentheses = standard error, *P<0.001. The model fit statistics were as follows: chi-square =1.300, df=1, chi-square/df=1.3, P=0.254; comparative fit index =0.999, and root mean square error approximation =0.029.
Abbreviation: df, degrees of freedom.
Abbreviation: df, degrees of freedom.