
Figures & data
Table 1 Sociodemographic characteristics of the patients and the control group
Table 2 Comparison of neutrophils, lymphocytes, NLR, TAS, TOS, OSI, PON1, T.thl, and T.thl/OSI ratio between the control group and patients with schizophrenia
Table 3 Relationship between PANSS and leukocyte, lymphocyte, NLR, TAS, TOS, OSI, PON1, T.thl values, and T.thl/OSI ratio
Table 4 The relationship between NLR and T.thl/OSI ratios in the patient and control groups
Table 5 Comparison of NLR and T.thl/OSI values with other parameters in patients with schizophrenia
Figure 1 ROC analysis of schizophrenic patients versus controls.
Abbreviations: NLR, neutrophil/lymphocyte ratio; OSI, oxidative stress index; PON1, paraoxonase; ROC, receiver operating characteristic; TAS, total antioxidant status; TOS, total oxidative status; T.thl, total thiol.
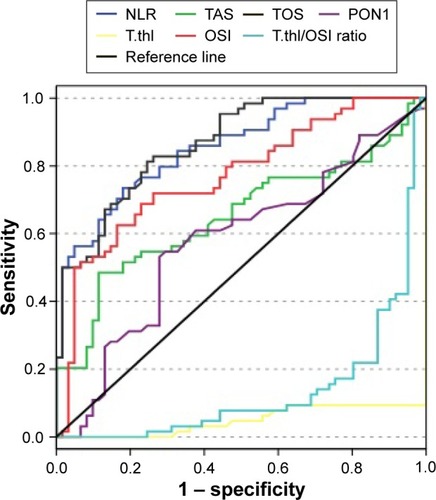
Table 6 ROC analysis data of NLR, TAS, TOS, PON1, T.thl, OSI, and T.thl/OSI ratio parameters