Figures & data
Table 1 Demographic characteristics of the POD and NPOD groups
Figure 1 The added morbidity of postoperative delirium (POD) days 1–3.
Note: The added morbidity of POD on postoperative day 3 was lower than that on postoperative days 1 (P<0.01) and 2 (P=0.01).
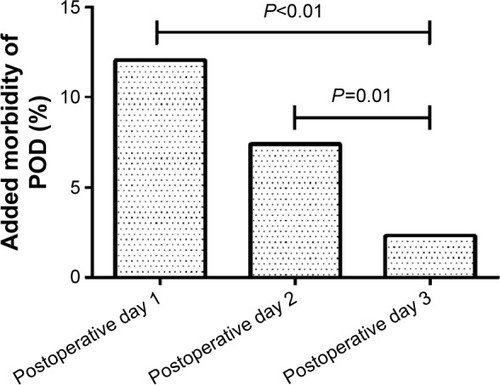
Figure 2 The type of postoperative delirium (POD).
Notes: Among the 56 patients with POD, 38 patients were diagnosed with hyperactive delirium, seven with hypoactive delirium, and eleven with mixed delirium.
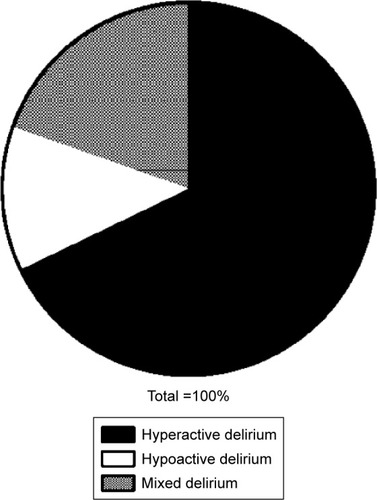
Figure 3 Concentration of interleukin (IL)-6 between the NPOD and POD groups.
Notes: There were no significant differences in the IL-6 levels between the two groups prior to surgery (T0) (P=0.60). At the end of surgery (T1) and 12 h after surgery (T2), the IL-6 levels were higher in the POD than that in NPOD group (P<0.01). At T1 and T2, the levels of IL-6 in each group were higher than those in the corresponding group at T0 (P<0.05).
Abbreviations: NPOD, no POD; POD, postoperative delirium; h, hours.
Abbreviations: NPOD, no POD; POD, postoperative delirium; h, hours.
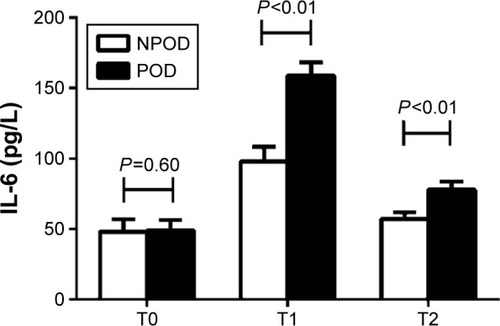
Figure 4 Concentration of CRP between the NPOD and POD groups.
Notes: There were no significant differences in the CRP levels between the two groups prior to surgery (T0) (P=0.55) and at the end of surgery (T1) (P=0.50). Furthermore, the CRP levels in each group at T1 were not different from those in the corresponding group at T0 (P>0.05). However, 12 h after surgery (T2), the CRP levels were higher in the POD than that in NPOD group (P<0.01). At T2, the levels of CRP in each group were higher than those in the corresponding group at T0 (P<0.05).
Abbreviations: CRP, C-reactive protein; NPOD, no POD; POD, postoperative delirium; h, hours.
Abbreviations: CRP, C-reactive protein; NPOD, no POD; POD, postoperative delirium; h, hours.
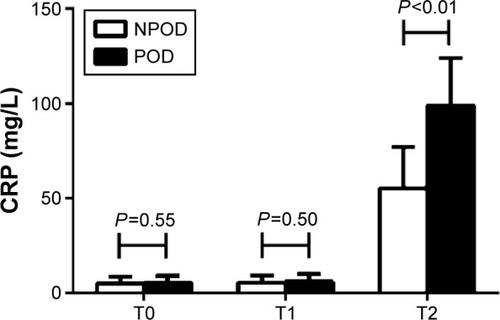
Figure 5 Concentration of PCT between the NPOD and POD groups.
Notes: There were no significant differences in the PCT levels between the two groups prior to surgery (T0) (P=0.14). At the end of surgery (T1) and 12 h after surgery (T2), the PCT levels were higher in the POD than that in NPOD group (P=0.02 and P<0.01). At T1 and T2, the levels of PCT in each group were higher than those in the corresponding group at T0 (P<0.05).
Abbreviations: NPOD, no POD; POD, postoperative delirium; PCT, procalcitonin; h, hours.
Abbreviations: NPOD, no POD; POD, postoperative delirium; PCT, procalcitonin; h, hours.
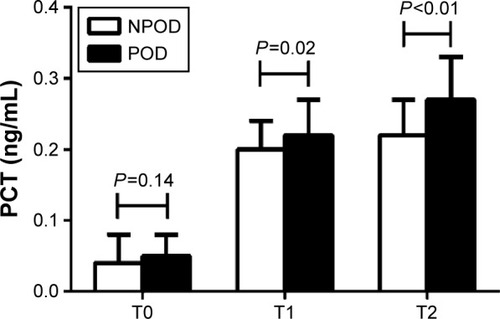
Figure 6 Concentration of cortisol between the NPOD and POD groups.
Notes: There were no significant differences in the cortisol levels between the two groups prior to surgery (T0) (P=0.15). At the end of surgery (T1) and 12 h after surgery (T2), the cortisol levels were higher in the POD than that in NPOD group (P<0.01). At T1 and T2, the levels of cortisol in each group were higher than those in the corresponding group at T0 (P<0.05).
Abbreviations: NPOD, no POD; POD, postoperative delirium; h, hours.
Abbreviations: NPOD, no POD; POD, postoperative delirium; h, hours.
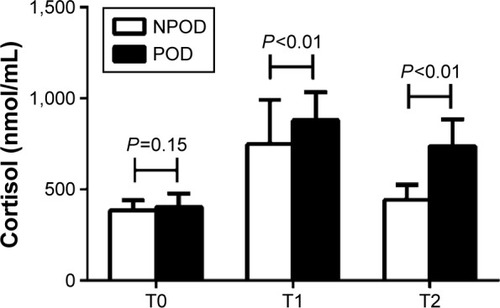
Figure 7 Concentration of Aβ1-40 between the NPOD and POD groups.
Notes: There were no significant differences in the Aβ1-40 levels between the two groups prior to surgery (T0) (P=0.17) and at the end of surgery (T1) (P=0.12). Furthermore, the Aβ1-40 levels in each group at T1 were not different from those in the corresponding group at T0 (P>0.05). However, 12 h after surgery (T2), the Aβ1-40 levels were higher in the POD than that in NPOD group (P<0.01). At T2, the levels of Aβ1-40 in each group were higher than those in the corresponding group at T0 (P<0.05).
Abbreviations: Aβ1-40, amyloid β1-40; NPOD, no POD; POD, postoperative delirium; h, hours.
Abbreviations: Aβ1-40, amyloid β1-40; NPOD, no POD; POD, postoperative delirium; h, hours.
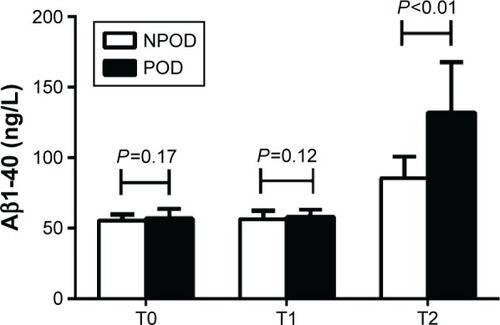
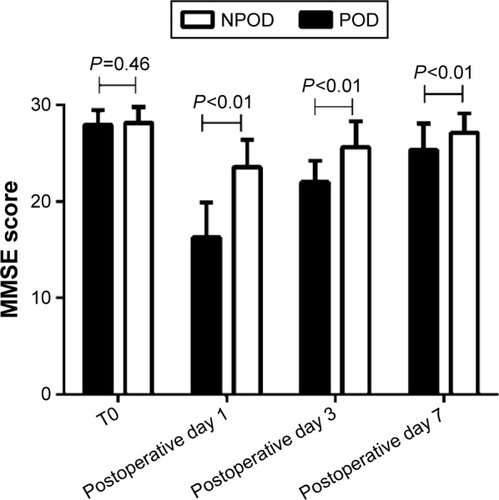
Figure 8 MMSE scores of the NPOD and POD groups during the perioperative period.
Note: No differences in the MMSE scores were found between the two groups at T0 (P=0.46), but the MMSE scores after surgery were lower in the POD than that in NPOD group (P<0.01).
Abbreviations: MMSE, Mini-Mental State Examination; NPOD, no POD; POD, postoperative delirium; T0, prior to surgery.
Abbreviations: MMSE, Mini-Mental State Examination; NPOD, no POD; POD, postoperative delirium; T0, prior to surgery.