
Figures & data
Figure 1 (A) Statistical maps corrected for age, education, and sex showing brain stem shape deformation associated with NPI sleep-disturbance subscale scores in patients with AD. (B) Group-comparison results of brain stem shape deformation between the AD group and the normal controls. Color coding of the surface reflects the FDR-corrected F-statistic values.
Abbreviations: NPI, Neuropsychiatric Inventory; AD, Alzheimer’s disease; FDR, false-discovery rate.
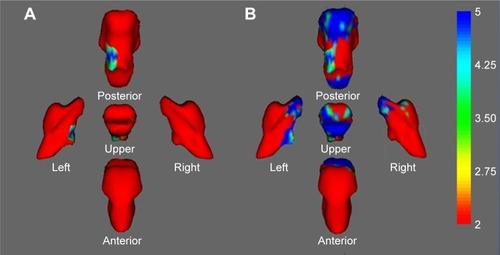
Figure 2 Negative association between normalized brain stem volumes and NPI sleep-subscale scores in the AD patients (r=−0.33, P=0.024).
Abbreviations: NPI, Neuropsychiatric Inventory; AD, Alzheimer’s disease.
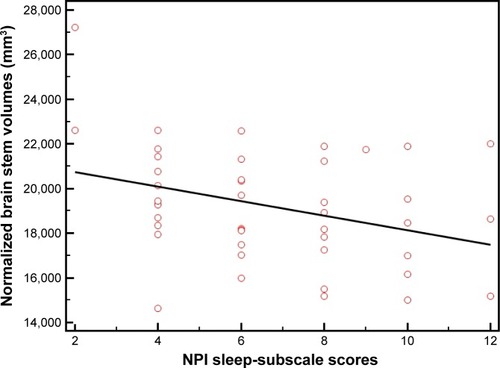
Table 1 Demographic and clinical characteristics of study participants