Figures & data
Table 1 Demographic characteristics at baseline
Table 2 Doses of antidepressants received by patients at the end of the titration period
Figure 1 MADRS total score (mean changes from baseline) over the first 8 weeks of treatment
Notes: The values are mean ± SEM of the observed case population (n = 60 milnacipran; n = 74 venlafaxine).
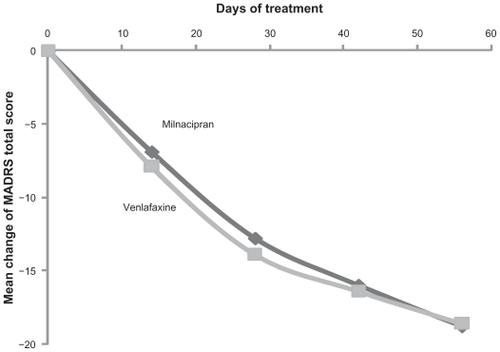
Figure 2 Responders and remissions (MADRS) after 8 weeks
Key: filled columns = responders (≥ 50% reduction in initial MADRS score); hatched columns = remissions (MADRS score ≤ 10).
Notes: Values are based on the whole randomized population using the last observer carried forward method population (n = 97 milnacipran; n = 98 venlafaxine).
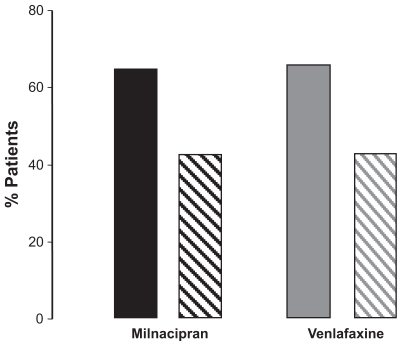
Table 3 Rates of response and remission
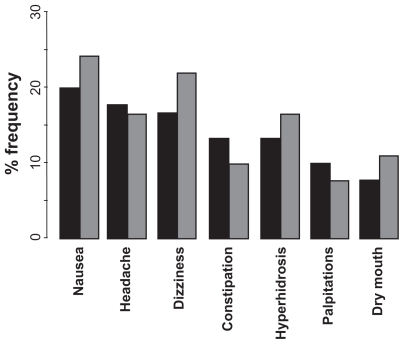
Figure 3 Principal adverse events experienced with milnacipran and venlafaxine during the study.
Key: black columns = milnacipran; grey columns = venlafaxine.
Notes: Only adverse events with a frequency ≥ 10% are shown.