
Figures & data
Table 1 Inclusion and exclusion criteria
Table 2 Demographic and clinical data – comparison of all enrolled patients and the patients who completed the study
Table 3 Scores in rating scales at the beginning of the treatment according to the diagnostic groups
Figure 1 Mean BDI-II and BAI scores each week during the treatment.
Abbreviations: BAI, Beck Anxiety Inventory; BDI, Beck Depressive Inventory, second edition; ns, not significant.
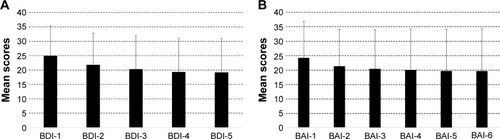
Table 4 Mean scores on the rating scales at the beginning and end of the treatment
Table 5 Changes in the rating scales and the level of dissociation during the treatment according to the qualitative demographic parameters, comorbidity, and psychotherapeutic approach
Table 6 Changes in the rating scales and the level of dissociation during the treatment according to the diagnostic groups
Table 7 Correlations of the relative change in BDI-II and BAI and the absolute change in CGI-S with demographic and clinical data
Table 8 Comparison of the patients with and without comorbid personality disorder
Table 9 Backward stepwise regression with BDI-II relative change as the dependent variable
Table 10 Backward stepwise regression with the BAI relative change as the dependent variable
Table 11 Backward stepwise regression with CGI-S absolute change as the dependent variable
Table 12 Logistic regression – predictors for achieving remission (CGI-S last 1 or 2)