Figures & data
Table 1 Demographics and clinical measurements by group
Figure 1 One-sample t-test results. Within-group ALFF maps within the HM (left) and HC (right) groups (P<0.001, FDR corrected).
Abbreviations: ALFF, amplitude of low-frequency fluctuation; FDR, false discovery rate; HC, healthy control; HM, high myopia; LH, left hemisphere; RH, right hemisphere.
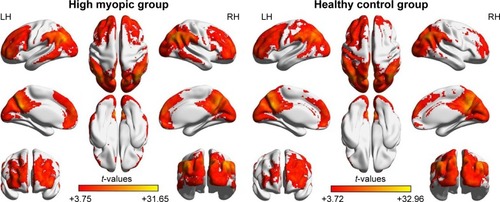
Figure 2 Spontaneous brain activity in the monocular blindness and healthy control groups.
Notes: Significant differences in activity were observed in the right inferior and middle temporal gyrus, left middle temporal gyrus, left inferior frontal gyrus/putamen, right inferior frontal gyrus/putamen/insula, right middle frontal gyrus, right inferior parietal lobule, bilateral midcingulate cortex, left postcentral gyrus, and left precuneus/inferior parietal lobule. The red or yellow areas denote higher ALFF values and the blue areas indicate lower ALFF values (P<0.01 for multiple comparisons using GRF theory) (z>2.3, P<0.01, cluster >40 voxels, AlphaSim corrected).
Abbreviations: ALFF, amplitude of low-frequency fluctuation; GRF, Gaussian random field; L, left; LH, left hemisphere; R, right; RH, right hemisphere.
Abbreviations: ALFF, amplitude of low-frequency fluctuation; GRF, Gaussian random field; L, left; LH, left hemisphere; R, right; RH, right hemisphere.
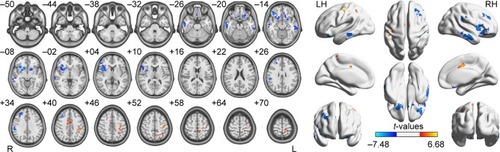
Figure 3 The mean values of altered ALFF values between the HM and HC groups.
Abbreviations: ALFF, amplitude of low-frequency fluctuation; HC, healthy control; HM, high myopia; IFG, inferior frontal gyrus; IPL, inferior parietal lobule; IS, insula; ITG, inferior temporal gyrus; MCC, midcingulate cortex; MFG, middle frontal gyrus; MTG, middle temporal gyrus; posCG, postcentral gyrus; preCU, precuneus; PT, putamen.
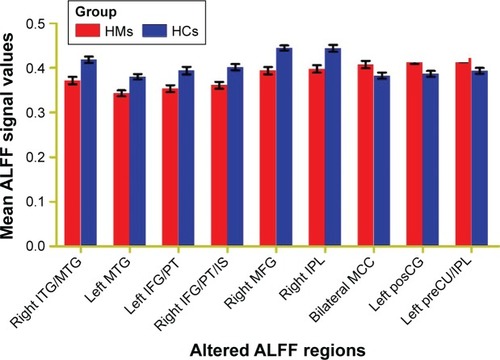
Table 2 Brain areas with significantly different ALFF values between the groups
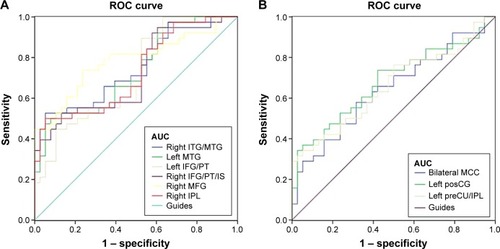
Figure 4 ROC curve analysis of the mean ALFF values for altered brain regions.
Notes: The AUCs were: 0.744 (P<0.001; 95% CI: 0.634–0.855) for the right ITG/MTG, 0.734 (P<0.001; 95% CI: 0.634–0.845) for the left MTG, 0.713 (P=0.001; 95% CI: 0.598–0.828) for the left IFG/PT, 0.725 (P=0.001; 95% CI: 0.611–0.839) for the right IFG/PT/IS, 0.783 (P<0.001; 95% CI: 0.677–0.888) for the right MFG, and 0.729 (P=0.001; 95% CI: 0.616–0.841) for the right IPL (HMs < HCs) (A). The AUCs were: 0.643 (P=0.032; 95% CI: 0.519–0.768) for the bilateral MCC, 0.679 (P=0.007; 95% CI: 0.558–0.801) for the left posCG, 0.659 (P=0.017; 95% CI: 0.536–0.783) for the left preCU/IPL (HMs > HCs) (B).
Abbreviations: ALFF, amplitude of low-frequency fluctuation; AUC, area under the curve; CI, confidence interval; HCs, healthy controls; HM, high myopia; IFG, inferior frontal gyrus; IPL, inferior parietal lobule; IS, insula; ITG, inferior temporal gyrus; MCC, midcingulate cortex; MFG, middle frontal gyrus; MTG, middle temporal gyrus; posCG, postcentral gyrus; preCU, precuneus; PT, putamen; ROC, receiver operating characteristic.
Abbreviations: ALFF, amplitude of low-frequency fluctuation; AUC, area under the curve; CI, confidence interval; HCs, healthy controls; HM, high myopia; IFG, inferior frontal gyrus; IPL, inferior parietal lobule; IS, insula; ITG, inferior temporal gyrus; MCC, midcingulate cortex; MFG, middle frontal gyrus; MTG, middle temporal gyrus; posCG, postcentral gyrus; preCU, precuneus; PT, putamen; ROC, receiver operating characteristic.