
Figures & data
Table 1 Description of participants
Table 2 Test and self-report data
Figure 1 HVLT-R total by group and time.
Abbreviations: HVLT-R, Hopkins Verbal Learning Test-Revised; tDCS, transcranial direct current stimulation.
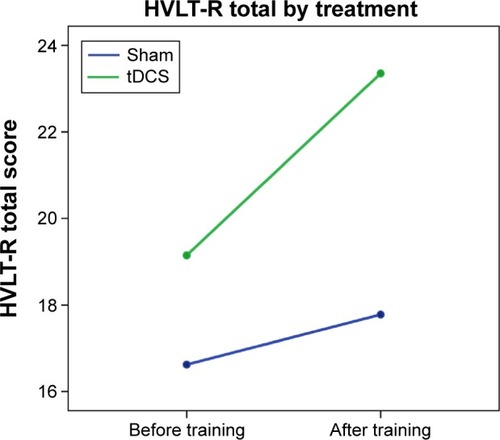
Figure 2 Grooved Pegboard dominant hand by group and time.
Abbreviation: tDCS, transcranial direct current stimulation.
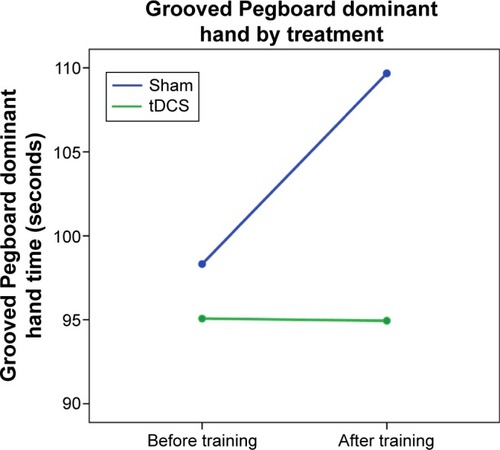
Figure 3 PAOF by group and time.
Abbreviations: PAOF, Patients Assessment of Own Functioning; tDCS, transcranial direct current stimulation.
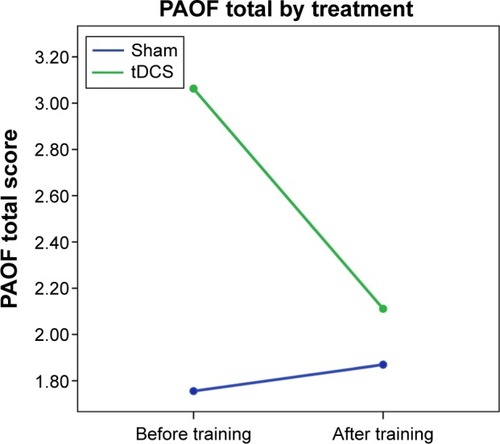
Table 3 Effect sizes for the interaction of group by time
Table S1 Nonparametric correlations (Spearman’s rho) for covariates, treatment, and outcomes