
Figures & data
Table 1 Distribution of adult patients who were newly diagnosed with ADHD from 2000 to 2011 in Taiwan
Figure 1 Sex distribution among three age groups in adult ADHD patients in Taiwan.
Abbreviations: ADHD, attention-deficit/hyperactivity disorder; y, years.
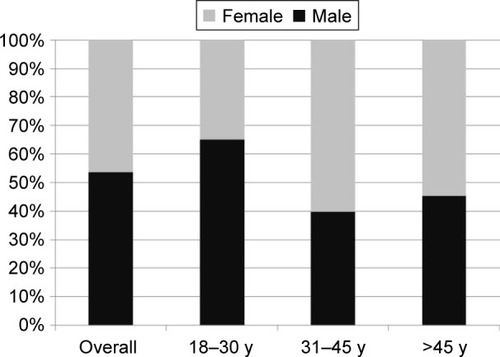
Table 2 Characteristics of adults newly diagnosed with ADHD (N=5,397) from 2000 to 2011 in Taiwan
Figure 2 Different durations of medication treatment among three age groups in adult ADHD patients in Taiwan.
Abbreviations: ADHD, attention-deficit/hyperactivity disorder; y, years.
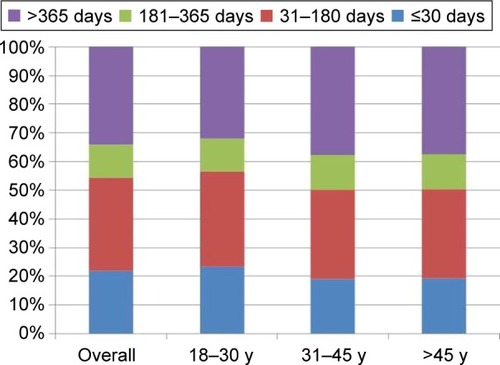
Table 3 Logistic regression model for factors associated with pharmacotherapy for adult ADHD