
Figures & data
Table 1 Descriptive analysis of the groups of families with children born preterm and at term
Table 2 Comparison of preterm group with control group (infants born at term)
Figure 1 Trend of the LTP parts in the preterm and at term groups.
Abbreviation: LTP, Lausanne Trialogue Play.
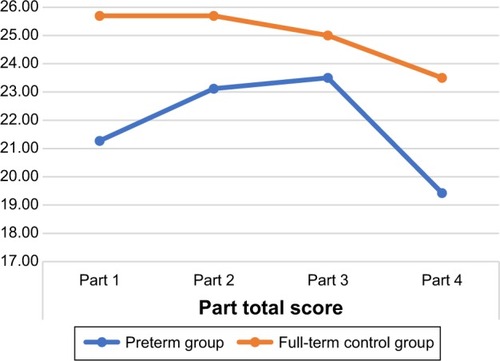
Table 3 Descriptive analysis of QUIT, PSI-SF, FES, MSPSS, and LTP results
Table 4 Correlations between LTP and PSI-SF, FES, and MSPSS
Table 5 Pearson’s correlations between PSI-SF and QUIT, FES, and MSPSS