
Figures & data
Table 1 Comparison of demographic data between control and type-2 DM group
Table 2 Comparison of subitems of PSQI between control and type-2 DM group
Figure 1 Comparison of PCS (A), MCS (B), and CES-D (C) scores among four groups categorized by groups and by the cutoff point (5.5) of PSQI total score.
Notes: Error bars indicate standard deviations. *P<0.05. CL-good, good sleepers in the control group; CL-poor, poor sleepers in the control group; DM-good, good sleepers in the type-2 DM group; DM-poor, poor sleepers in the type-2 DM group.
Abbreviations: PCS, physical component summary from SF-8; MCS, mental component summary from SF-8; CES-D, Center for Epidemiologic Studies Depression Scale; PSQI, Pittsburgh Sleep Quality Index.
Abbreviations: PCS, physical component summary from SF-8; MCS, mental component summary from SF-8; CES-D, Center for Epidemiologic Studies Depression Scale; PSQI, Pittsburgh Sleep Quality Index.
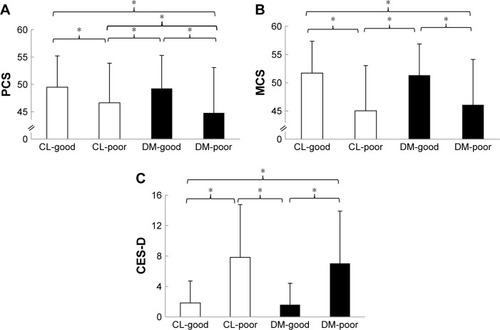
Table 3 Univariate and multivariate logistic regression results for factors associated with insomnia among type-2 DM