
Figures & data
Figure 1 Flowchart for participant selection.
Abbreviations: APGAR, Adaptability, Partnership, Growth, Affection, and Resolve; MINI, Mini International Neuropsychiatric Interview.
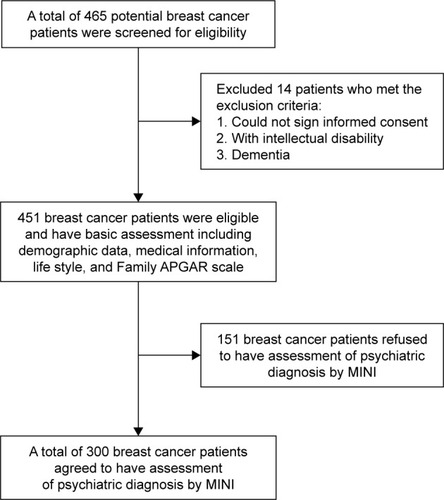
Table 1 Baseline characteristics of breast cancer patients between MINI responders and non-responders
Table 2 Prevalence of major depression based on risk factors in breast cancer patients (N=300)
Table 3 Logistic regression analyses of factors associated with major depression