
Figures & data
Table 1 Variables selected for univariate analyses to identify factors associated with remission at month 2 and relapse at month 6 for patients in remission at month 2
Table 2 Baseline sociodemographic characteristics for subsets of patients by remission status at month 2 and by relapse status at month 6 in those who achieved remission at month 2
Table 3 Medical profile, functioning, and quality of life at baseline for subsets of patients by remission status at month 2 and by relapse status at month 6 in those who achieved remission at month 2
Table 4 Multivariate logistic regression model for analysis of risk factors of failure to achieve remission at month 2 (backward selection)
Table 5 Multivariate logistic regression model for analysis of risk factors of relapse at month 6 for patients in remission at month 2 (backward selection)
Figure S1 Summary of supportive analyses of PDQ-5 effect on relapse at month 6.
Notes: aComputed for patients with complete values on all candidate variables (n=186); bcomputed for patients with complete values on all variables in the final model (n=193); cadditional criterion for relapse definition: minimum change in PHQ-9 total score between month 2 and month 6. Values expressed as OR (95% CI).
Abbreviations: MADRS, Montgomery–Åsberg Depression Rating Scale; PHQ-9, 9-item Public Health Questionnaire.
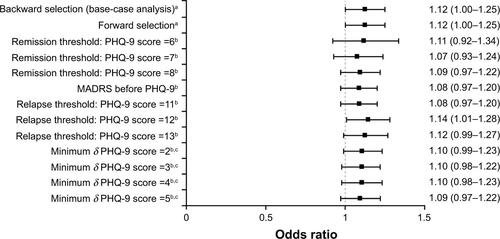
Figure S2 Summary of supportive analyses of PHQ-9 effect on relapse at month 6.
Notes: aComputed for patients with complete values on all candidate variables (n=186); bcomputed for patients with complete values on all variables in the final model (n=193); cadditional criterion for relapse definition: minimum change in PHQ-9 total score between month 2 and month 6. Values expressed as OR (95% CI).
Abbreviations: MADRS, Montgomery–Åsberg Depression Rating Scale; PHQ-9, 9-item Public Health Questionnaire.
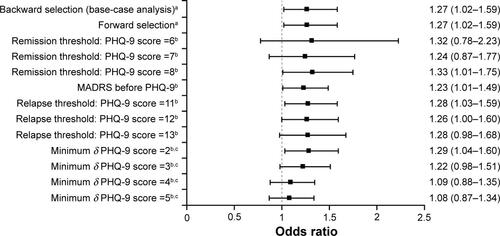
Table S1 Details of backward-selection process for analysis of factors associated with remission at month 2
Table S2 Details of backward-selection process for analysis of factors associated with relapse at month 6 for patients in remission at month 2
Table S3 Complementary analysis comparing factors identified as potential indicators of severity and chronicity of depression according to psychotherapy at baseline