
Figures & data
Figure 1 ROC curve for depressive disorder determined using the MINI and the CES-D.
Abbreviations: CES-D, Center for Epidemiologic Studies Depression Scale; MINI, Mini International Neuropsychiatric Interview; ROC, receiver operating characteristic.
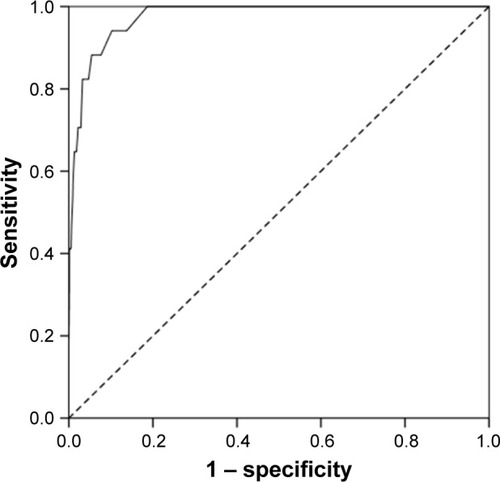
Table 1 Sensitivity, specificity, and positive and negative predictive values of the CES-D
Table 2 SSLRs obtained for MDD in this study