Figures & data
Table 1 Clinical data flowchart in IBS patients
Figure 1 Presence and severity of comorbidities: GAD, FA, DB, CPP, and FM in (A) migraine-negative group and (B) migraine-positive group.
Abbreviations: CPP, chronic pelvic pain; DB, dysbiosis; FA, food allergy; FM, fibromyalgia; GAD, generalized anxiety disorder.
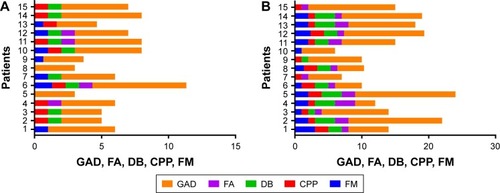
Figure 2 Severity of anxiety (GAD) in IBS research participants.
Abbreviations: GAD, generalized anxiety disorder; IBS, irritable bowel syndrome.
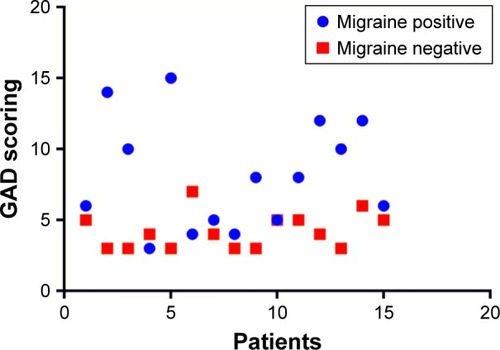
Table 2 Biological flowchart in IBS research participants
Figure 3 Study of DB severity in IBS patients.
Abbreviations: DB, dysbiosis; IBS, irritable bowel syndrome.
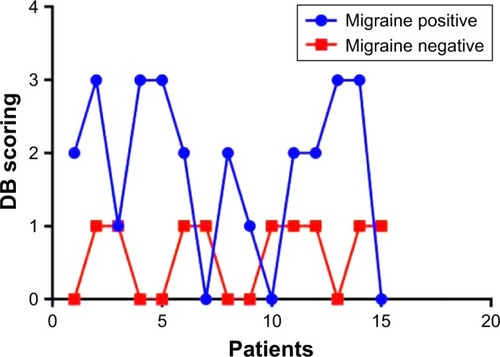
Figure 4 MIDAS correlations with DB, FM, FA, GAD, and CPP in migraine-positive patients.
Abbreviations: CPP, chronic pelvic pain; DB, dysbiosis; FA, food allergy; FM, fibromyalgia; GAD, generalized anxiety disorder; MIDAS, migraine disability.
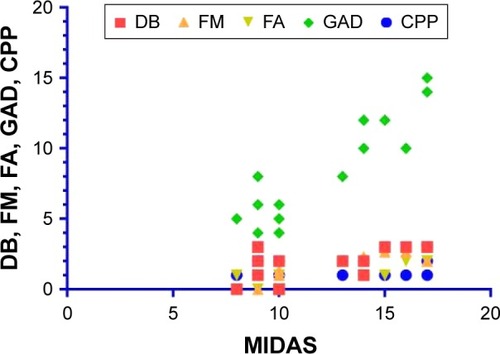
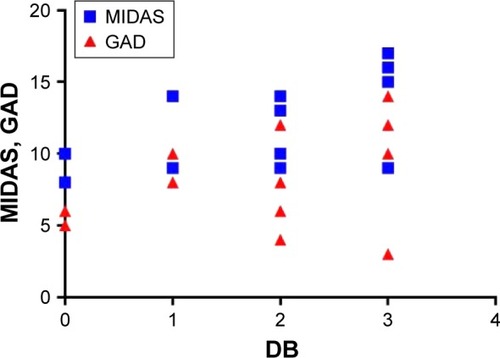
Figure 5 Fecal DB correlations: MIDAS and GAD in migraine-positive patients.
Abbreviations: DB, dysbiosis; GAD, generalized anxiety disorder; MIDAS, migraine disability.