
Figures & data
Table 1 Depression clinical outcomes at week 12
Figure 1 Major depressive disorder cost.
Note: Data retrieved from Greenberg et alCitation9 to show which costs were included and converted to 2016 USD$.
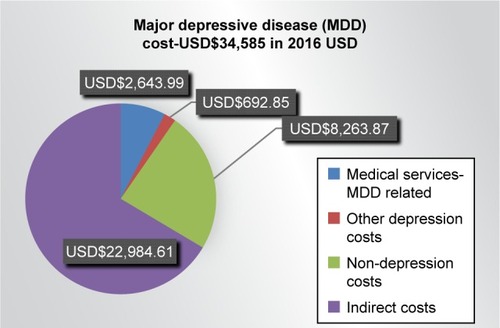
Table 3 Patients requiring treatment
Table 2 Annualized cost of MDD management in 2016 by treatment status
Figure 2 Cost-savings calculation.
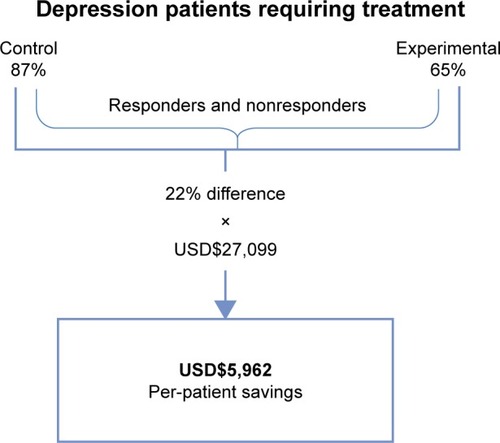
Table 4 Published per-patient savings using genetic testing to guide medication management (adjusted to 2016 dollars)