Figures & data
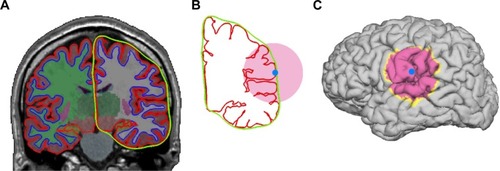
Figure 1 Gyrification index measurement.
Notes: (A) An example of reconstructed data using FreeSurfer. Pial surfaces (red), outer smoothed surfaces (green), and surfaces between white and gray matter are shown. (B, C) A spherical ROI (pink) in 2D space and the center of the ROI (light blue) on the two surfaces (B) and 3D model of the brain (C). LGI is the ratio between two areas (or lengths in 2D space) within the ROI. The LGI value is at the center point.
Abbreviations: LGI, local gyrification index; ROI, region of interest.
Abbreviations: LGI, local gyrification index; ROI, region of interest.