Figures & data
Figure 1 Multiplan reconstructions of 3D time-of-flight MRA images in transverse plane at the superior collicular level. (A) The first MR examination, (B) follow-up 2 years later.
Abbreviations: AP, anteroposterior; MR, magnetic resonance; MRA, magnetic resonance angiography.
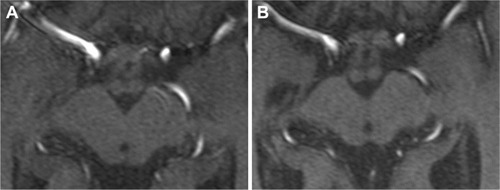
Figure 2 Sagittal spin-echo T1-weighted magnetic resonance images on follow-up examination show mild midbrain atrophy with “hummingbird” sign (arrow).
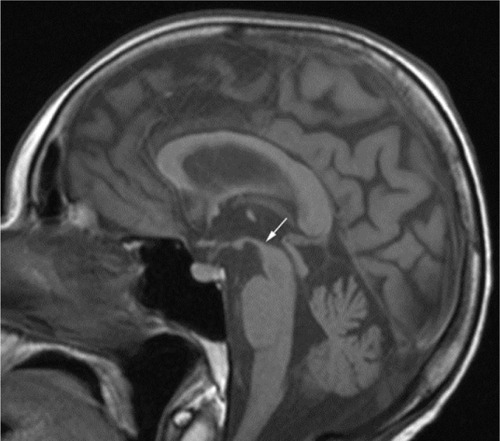
Figure 3 Transverse turbo spin-echo T2-weighted images on follow-up examination (A) at the basal ganglia and (B) at the pontine level.
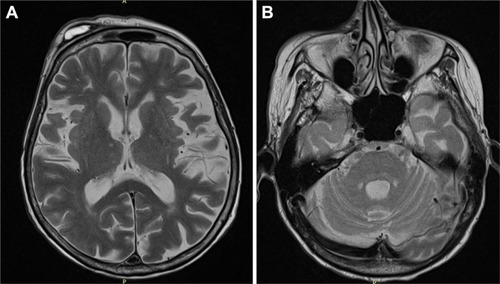
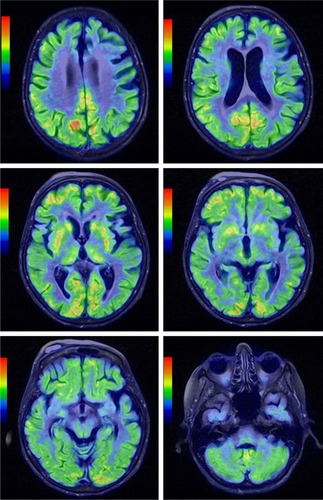
Figure 4 Brain three-dimensional stereotactic surface projection maps of positron emission tomography scans with activity maps in the top two rows and z maps showing deviation from a normal control cohort in the third and fourth rows.
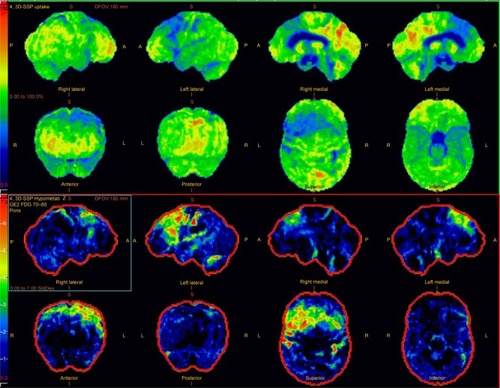
Figure 5 Coregistered PET and MR images in axial views in different levels demonstrating generalized brain atrophy, more prominent in the posterior frontal lobe, and hypometabolism of both cerebral hemispheres that was especially pronounced in the middle and posterior part of the left frontal lobe. Diffusely decreased metabolism was noted in the basal ganglia.