
Figures & data
Figure 1 Changes from baseline to month 24 in: (A) SDS total score (range 0–30), (B) WPAI absenteeism and presenteeism scores (range 0–100), (C) PHQ-9 total score (range 0–27), and (D) PDQ-5 total score (range 0–20; analyzable population; N=1,159).
Notes: Data are mean ± standard error; higher scores indicate worse outcomes.
Abbreviations: PDQ-5, five-item Perceived Deficit Questionnaire; PHQ-9, nine-item Patient Health Questionnaire; SDS, Sheehan Disability Scale; WPAI, Work Productivity and Activity Impairment.
Abbreviations: PDQ-5, five-item Perceived Deficit Questionnaire; PHQ-9, nine-item Patient Health Questionnaire; SDS, Sheehan Disability Scale; WPAI, Work Productivity and Activity Impairment.
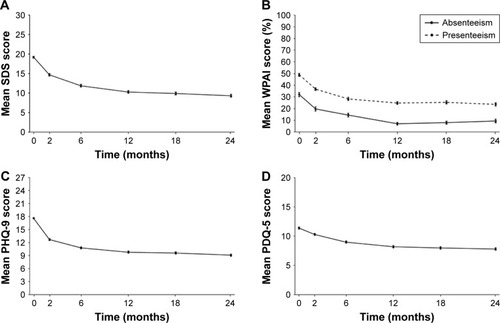
Table 1 Factors associated with functional impairment at baseline in the final multivariate analysis
Table 4 Factors associated with functional impairment at months 18 and 24 combined in the final multivariate analysis (MMRM)
Table 2 Factors associated with functional impairment at month 2 in the final multivariate analysis
Table 3 Factors associated with functional impairment at months 6 and 12 combined in the final multivariate analysis (MMRM)