Figures & data
Figure 1 Forest plot of the HAM-D17 total score by subgroups: difference between venlafaxine ER treatment group and the placebo group in the adjusted mean change from baseline at Week 8 with 95% CIs (FAS, LOCF, ANCOVA model).
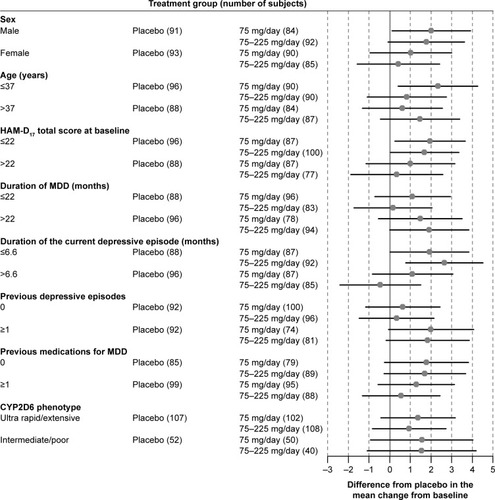
Figure 2 Forest plot of the HAM-D6 score by subgroups: difference between venlafaxine ER treatment group and the placebo group in the adjusted mean change from baseline at Week 8 with 95% CIs (FAS, LOCF, ANCOVA model).
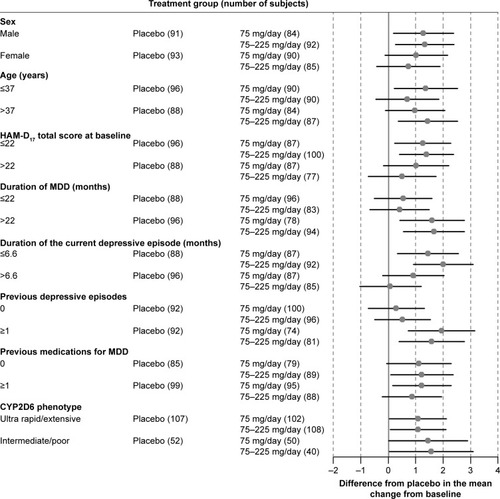
Figure 3 Forest plot of the MADRS total score by subgroups: difference between venlafaxine ER treatment group and the placebo group in the adjusted mean change from baseline at Week 8 with 95% CIs (FAS, LOCF, ANCOVA model).
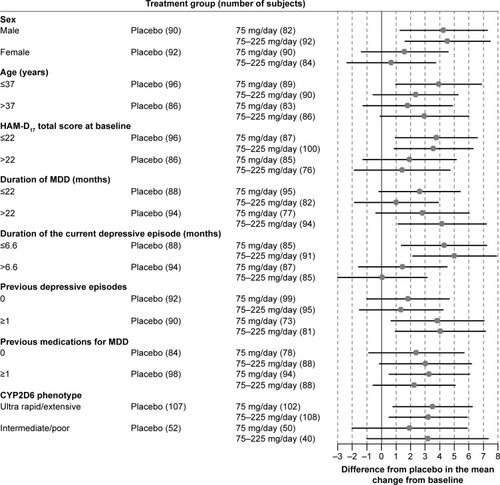
Figure 4 Adjusted mean change from baseline at Week 8 with 95% CIs by duration of MDD (≤22 months/>22 months) in each efficacy endpoint (FAS, LOCF, ANCOVA model).
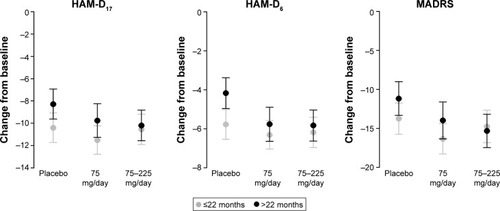
Figure 5 Adjusted mean change from baseline in each efficacy endpoint at Week 8 with 95% CIs by duration of MDD (A) <12 months/≥12 months, and (B) <48 months/≥48 months (FAS, LOCF, ANCOVA model).
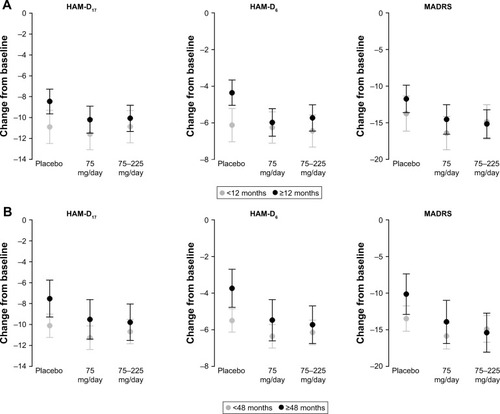
Table 1 Demographic and disease characteristics by duration of MDD (≤22 months/>22 months) (FAS)
Figure 6 Adjusted mean change from baseline at Week 8 with 95% CIs by HAM-D17 total score at baseline (total score ≤22/total score >22) in each efficacy endpoint (FAS, LOCF, ANCOVA model).
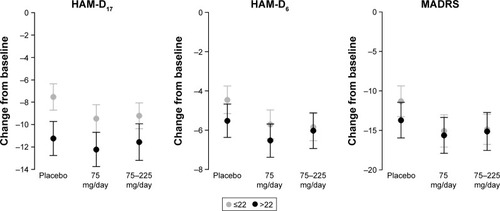
Figure 7 Adjusted mean change from baseline at Week 8 with 95% CIs by history of previous depressive episodes (0 [single episode]/≥1 [recurrent episodes]) in each efficacy endpoint (FAS, LOCF, ANCOVA model).
![Figure 7 Adjusted mean change from baseline at Week 8 with 95% CIs by history of previous depressive episodes (0 [single episode]/≥1 [recurrent episodes]) in each efficacy endpoint (FAS, LOCF, ANCOVA model).](/cms/asset/2468e920-b6cd-4a7b-9685-d9acef9cab7c/dndt_a_146428_f0007_b.jpg)
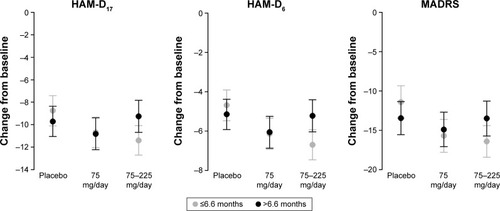
Figure 8 Adjusted mean change from baseline at Week 8 with 95% CIs by duration of current depressive episode (≤6.6 months/>6.6 months) in each efficacy endpoint (FAS, LOCF, ANCOVA model).