
Figures & data
Table 1 Sample search strategy – Embase
Table 2 Studies analyzing the effects of RAC on gait
Figure 1 PRISMA (Preferred Reporting Items for Systematic Reviews and Meta-Analyses) flowchart for inclusion of studies.
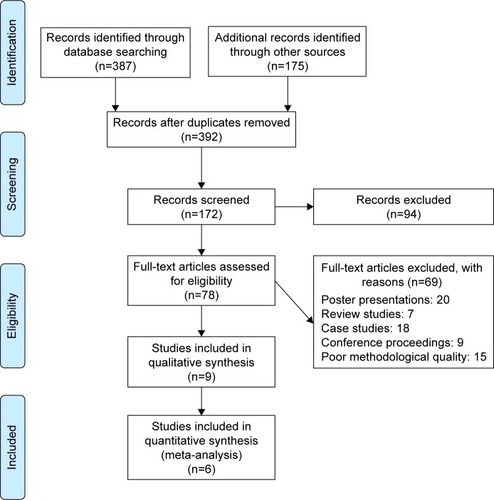
Figure 2 Risk of bias across studies.
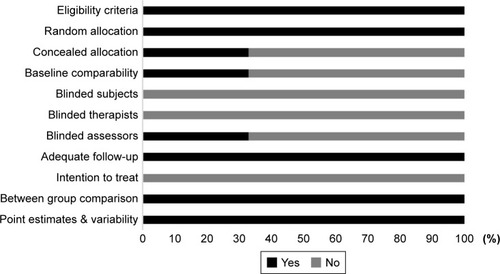
Figure 3 Forest plot illustrating individual studies evaluating the effects of rhythmic auditory cueing on gait velocity in people with cerebral palsy.
Abbreviations: A, adults; C, children.
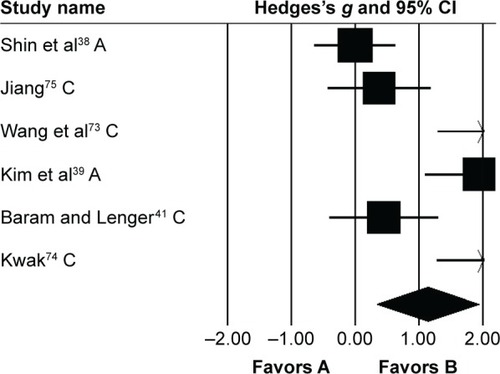
Figure 4 Forest plot illustrating individual studies evaluating the effects of rhythmic auditory cueing on stride length in people with cerebral palsy.
Abbreviations: A, adults; C, children.
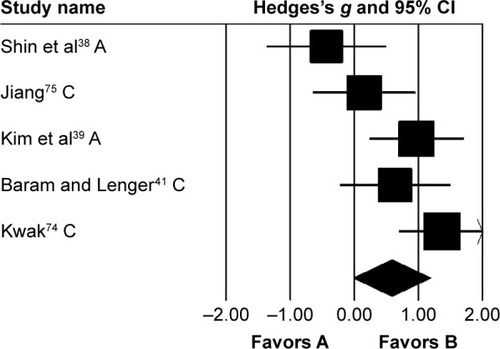
Figure 5 Forest plot illustrating individual studies evaluating the effects of rhythmic auditory cueing on cadence in people with cerebral palsy.
Abbreviations: A, adults; C, children.
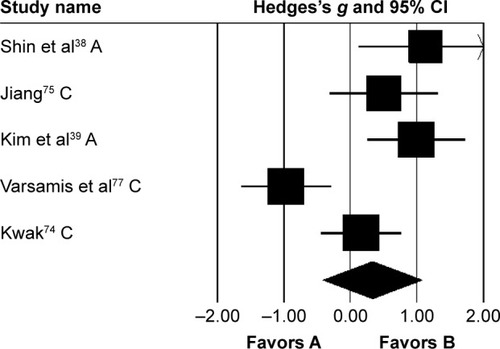
Figure 6 Forest plot illustrating individual studies evaluating the effects of rhythmic auditory cueing on gait-dynamic index in people with cerebral palsy.
Abbreviations: A, adults; C, children; H, household dwellers.
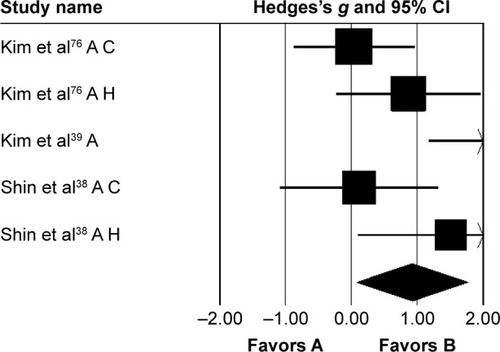
Figure S1 Forest plot illustrating individual studies evaluating the effects of rhythmic auditory cueing on gait velocity in children with cerebral palsy.
Notes: Negative effects indicate reduction in gait velocity, positive effects enhancement in gait velocity. Weighted-effect sizes – Hedge’s g (boxes) and 95% CI (whiskers) – demonstrate repositioning errors for individual studies. The diamond represents pooled effect sizes and 95% CI. Negative mean differences indicate favorable outcomes for control groups, positive mean differences favorable outcomes for experimental groups.
Abbreviation: C, children.
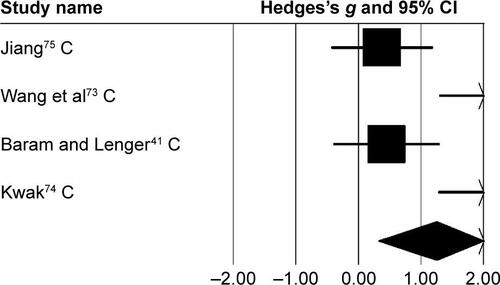
Figure S2 Forest plot illustrating individual studies evaluating the effects of rhythmic auditory cueing on gait velocity in children with cerebral palsy posttraining.
Notes: Negative effects indicate reduction in gait velocity, positive effect sizes enhancement in gait velocity. Weighted-effect sizes – Hedge’s g (boxes) and 95% CI (whiskers) – demonstrate repositioning errors for individual studies. The diamond represents pooled effect sizes and 95% CI. Negative mean differences indicate favorable outcomes for control groups, positive mean differences favorable outcomes for experimental groups.
Abbreviation: C, children.
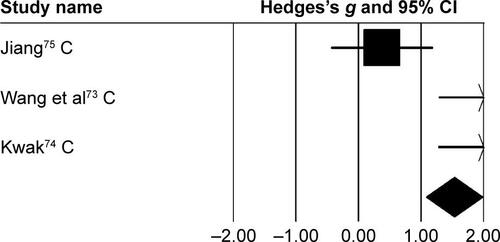
Figure S3 Forest plot illustrating individual studies evaluating the effects of rhythmic auditory cueing on stride length in children with cerebral palsy.
Notes: Negative effects indicate reduction in stride length, positive effects enhancement in stride length. Weighted-effect sizes – Hedge’s g (boxes) and 95% CI (whiskers) – demonstrate repositioning errors for individual studies. The diamond represents pooled effect sizes and 95% CI. Negative mean difference indicate favorable outcomes for control groups, positive mean difference favorable outcomes for experimental groups.
Abbreviation: C, children.
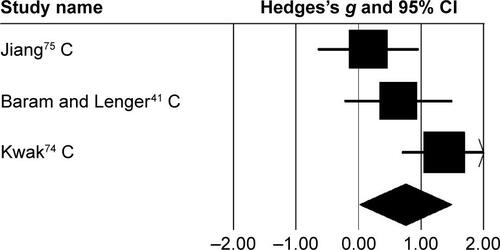
Figure S4 Forest plot illustrating individual studies evaluating the effects of rhythmic auditory cueing on pelvic kinematics in adults with cerebral palsy.
Notes: Negative effects indicate reduction in pelvic kinematics, positive effects enhancement in pelvic kinematics. Weighted-effect sizes – Hedge’s g (boxes) and 95% CI (whiskers) – demonstrate repositioning errors for individual studies. The diamond represents pooled effect sizes and 95% CI. Negative mean differences indicates favorable outcomes for control groups, positive mean differences favorable outcomes for experimental groups.
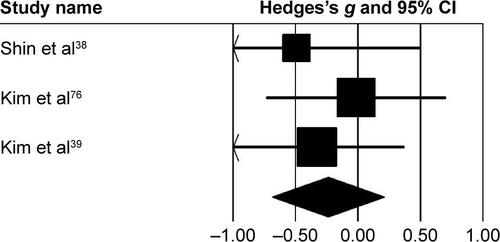
Figure S5 Forest plot illustrating individual studies evaluating the effects of rhythmic auditory cueing on hip kinematics in adults with cerebral palsy.
Notes: Negative effects indicate reduction in hip kinematics, positive effects enhancement in hip kinematics. Weighted-effect sizes – Hedge’s g (boxes) and 95% CI (whiskers) – demonstrate repositioning errors for individual studies. The diamond represents pooled effect sizes and 95% CI. Negative mean differences indicate favorable outcomes for control groups, positive mean differences favorable outcomes for experimental groups.
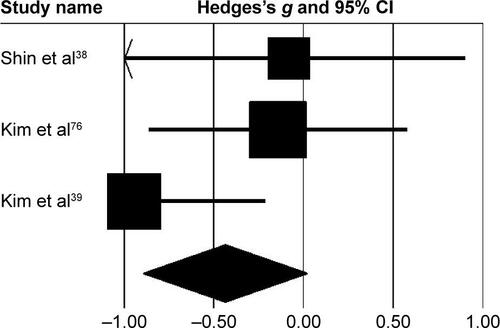
Figure S6 Forest plot illustrating individual studies evaluating the effects of rhythmic auditory cueing on knee kinematics in adults with cerebral palsy.
Notes: Negative effects indicate reduction in knee kinematics, positive effects enhancement in knee kinematics. Weighted-effect sizes – Hedge’s g (boxes) and 95% CI (whiskers) – demonstrate repositioning errors for individual studies. The diamond represents pooled effect sizes and 95% CI. Negative mean differences indicate favorable outcomes for control groups, positive mean differences favorable outcomes for experimental groups.
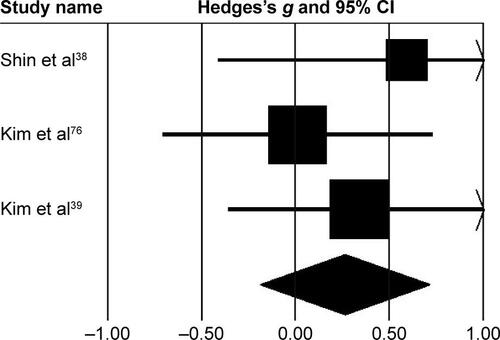
Figure S7 Forest plot illustrating individual studies evaluating the effects of rhythmic auditory cueing on ankle kinematics in adults with cerebral palsy.
Notes: Negative effect sizes indicate reduction in ankle kinematics, positive effects enhancement in ankle kinematics. Weighted-effect sizes – Hedge’s g (boxes) and 95% CI (whiskers) – demonstrating repositioning errors for individual studies. The diamond represents pooled effect sizes and 95% CI. Negative mean differences indicate favorable outcomes for control groups, positive mean difference favorable outcomes for experimental groups.
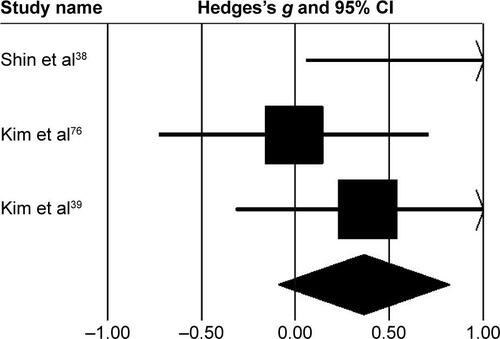
Figure S8 Forest plot illustrating individual studies evaluating the effects of rhythmic auditory cueing on foot kinematics in adults with cerebral palsy.
Notes: Negative effects indicated reduction in foot kinematics, positive effects enhancement in foot kinematics. Weighted-effect sizes – Hedge’s g (boxes) and 95% CI (whiskers) – demonstrate repositioning errors for individual studies. The diamond represents pooled effect sizes and 95% CI. Negative mean differences indicate favorable outcomes for control groups, positive mean differences favorable outcomes for experimental groups.
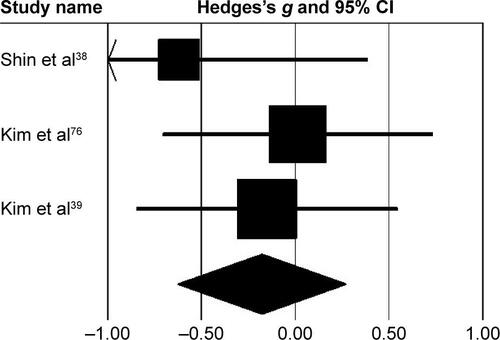
Table S1 Individual PEDro scores