
Figures & data
Table 1 Demographic data concerning age, sex proportion, BMI, and education in the different groups
Table 2 Concentrations of catecholamine metabolites (ng/mL) in plasma (p) and urine (u) (ng/day)
Figure 1 Changes in monoamine metabolite concentrations after the 7-day medication period.
Notes: (A) P=0.001; (B) P=0.009; (C) P=0.006.
Abbreviations: HVA, homovanillic acid; MHPG, 3-methoxy-4-hydroxyphenylglycol; VMA, vanillylmandelic acid.
Abbreviations: HVA, homovanillic acid; MHPG, 3-methoxy-4-hydroxyphenylglycol; VMA, vanillylmandelic acid.
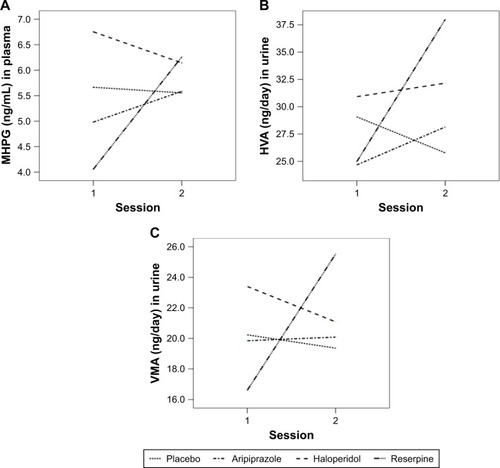
Table 3 Correlations among catecholamine metabolites in plasma and urine, scales for third-party assessment, and subjective assessment of some aspects of the mental condition
Figure 2 Prolactin (Prl) changes versus scales for third-party and subjective assessment.
Abbreviations: PANSS, Positive and Negative Syndrome Scale; HRSD, Hamilton Rating Scale for Depression; BDI, Beck Depression Inventory; VAS, visual analogue scale.
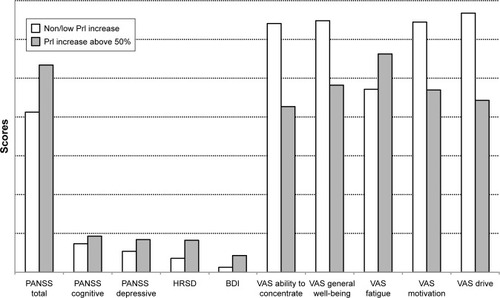
Table 4 Prolactin changes vs scales for third-party and subjective assessment
Table 5 Prolactin concentrations (mU/L) before and after 7-day medication period