Figures & data
Table 1 Patient’s clinical and demographic characteristics
Figure 1 Comparison of vitality before treatment and 3 months after treatment in the 2 groups, control (placebo) and experimental.
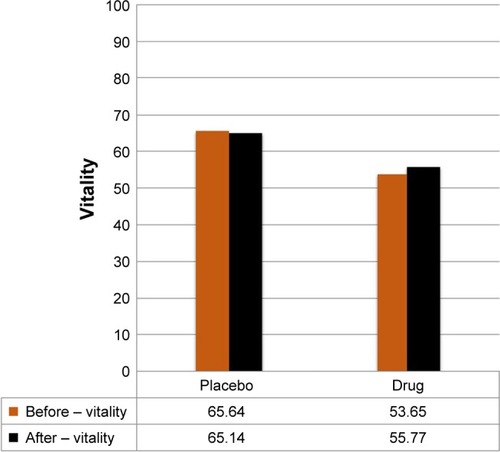
Figure 2 Comparison of scores on the pain scale before treatment and 3 months after treatment in the 2 groups, control (placebo) and experimental.
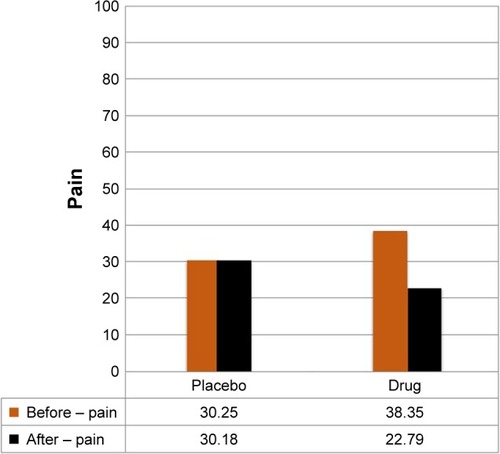
Figure 3 Comparison of cognitive function before treatment and 3 months after treatment in both groups, control (placebo) and experimental.
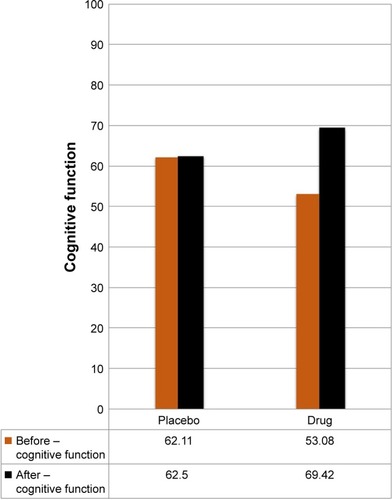
Figure 4 Comparison of overall life satisfaction before treatment and 3 months after treatment in both groups, control (placebo) and experimental.
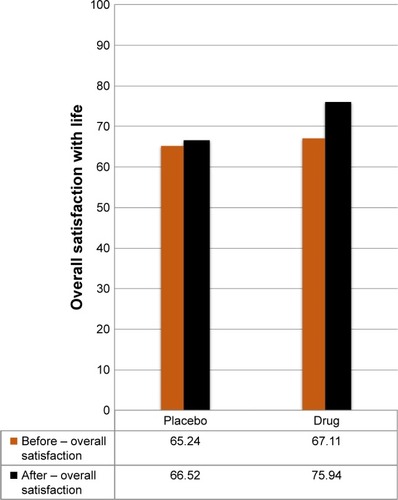
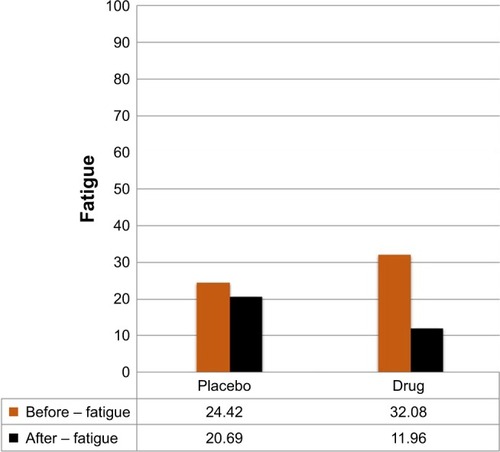
Figure 5 Comparison of fatigue scale scores before treatment and 3 months after treatment in both groups, control (placebo) and experimental.