Figures & data
Figure 1 The experimental design.
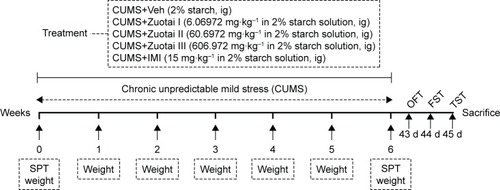
Figure 2 Changes in body weight in mice over the course of 6 weeks. (A) The changing trend of body weight during 6 weeks of treatment (mean ± SEM, n=10) compared to the control group, #P<0.05, ##P<0.01, ###P<0.001; compared to the CUMS+Veh group, *P<0.05, **P<0.01, ***P<0.001. (B) Body weight gain (Δweight) of mice after 6 weeks treatment (mean ± SEM, n=10). CUMS+Veh vs control, ###P>0.001; compared to the CUMS+Veh group, *P<0.05, **P<0.01, and ***P<0.001.
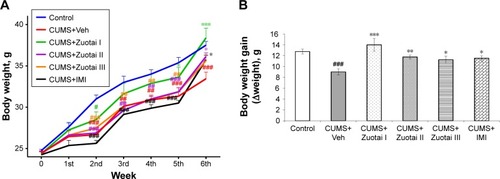
Figure 3 Sucrose preference ratio scores of each group of mice at days 0 and 42 of administration. (A) Baseline SPR scores of each group of mice at Day 0 of administration (mean ± SEM, n=10), compared to control group. (B) Sucrose preference ratio of each group after 6 weeks of treatment (mean ± SEM, n=10), CUMS+Veh compared to control group, ###P<0.001; compared to CUMS+Veh group, ***P<0.001.
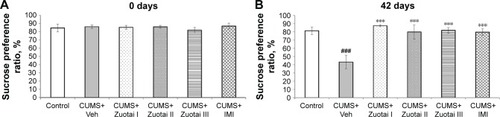
Figure 4 Duration of immobility in mice in the forced swimming test (mean ± SEM, n=10). CUMS+Veh group compared to control group, ##P<0.01; compared to CUMS+Veh group, *P<0.05, **P<0.01.
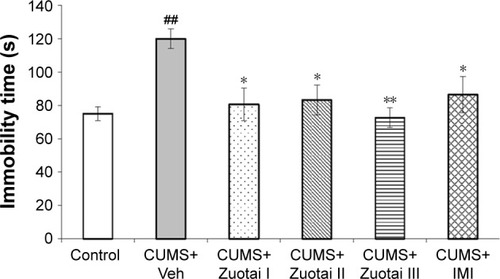
Figure 5 Immobility time of each group of mice in the tail suspension test (mean ± SEM, n=10). CUMS+Veh group compared to control group, ##P<0.01; compared to CUMS+Veh group, *P<0.05, ***P<0.01.
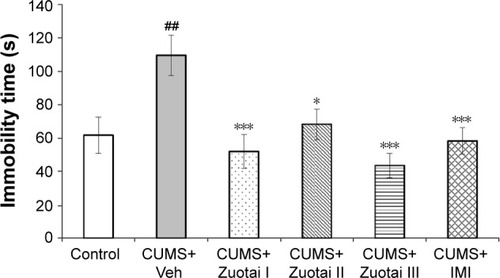
Figure 6 The OFT results of each group mice. (A) Total immobility time of each group mice in OFT (mean ± SEM, n=10), CUMS+Veh group compared to control group, ##P<0.01; Compared to CUMS+Veh group, *P<0.05, ***P<0.001. (B) Total movement distance of each group mice in OFT (mean ± SEM, n=10), CUMS+Veh group compared to control group, #P<0.05; compared to CUMS+Veh group, *P<0.05, **P<0.01, ***P<0.001. (C) Percentage of time for each group mice to reach the central area in OFT (mean ± SEM, n=10), CUMS+Veh group compared to control group, ##P<0.01; compared to the CUMS+Veh group, **P<0.01, ***P<0.001. (D) The motion trajectory map of each group of mice in the OFT (red refers to the maximum rest time of mouse in the region, and blue refers to no mouse resting in the region).
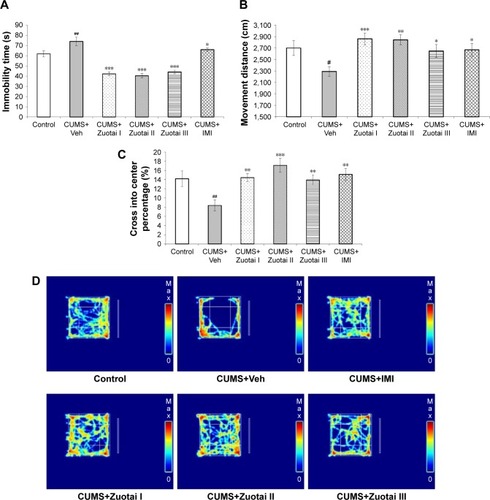
Figure 7 Neuroendocrine hormones (CRH, ACTH, and Cort) in the HPA axis. (A) CRH level of each group mice in the hypothalamus (mean ± SEM, n=10); (B) Serum ACTH levels of each group of mice (mean ± SEM, n=10); (C) Serum Cort levels of each group of mice (mean ± SEM, n=10). CUMS+Veh group compared to the control group, #P<0.05, ##P<0.01; compared to the CUMS+Veh group, *P<0.05, **P<0.01.
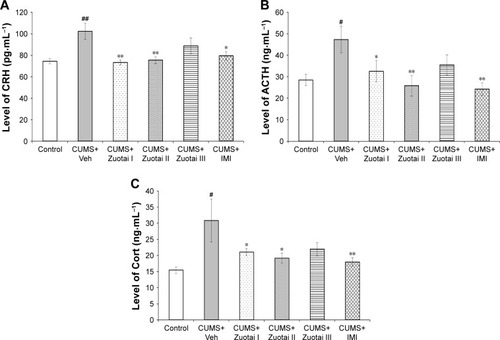
Figure 8 Serum levels of monoamine neurotransmitters (NE and 5-HT). (A) Serum 5-HT levels of each group mice after 6 weeks of administration (mean ± SEM, n=10); (B) Serum NE levels of each group mice after 6 weeks of administration (mean ± SEM, n=10), CUMS+Veh group compared to control group, #P<0.05, ##P<0.01; compared to the CUMS+Veh group, *P>0.05, **P<0.01, and ***P<0.001.
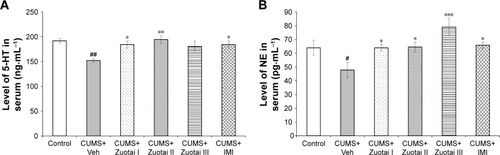
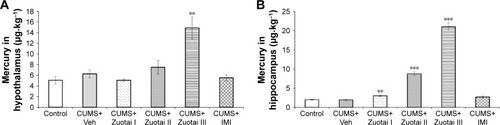
Figure 9 Mercury levels in both cerebric areas (hypothalamus and hippocampus) of each group of mice. (A) Mercury levels in the hypothalamus of each group of mice after 6 weeks of drug administration (mean ± SEM, n=10); (B) Mercury levels in the hippocampus of each group mice after 6 weeks of treatment administration (mean ± SEM, n=10). Compared to control group, **P<0.01, ***P<0.001.