
Figures & data
Table 1 Demographic profile of 50 people with schizophrenia prescribed PP
Table 2 MSQ descriptive statistics relating to paliperidone palmitate
Figure 1 Line graph to compare the least squares mean for the cluster score data of paliperidone palmitate and the other antipsychotic drugs group ranked by monetary costs per day (1 lowest cost to 7 highest cost).
Abbreviations: adj, adjusted; SE, standard error.
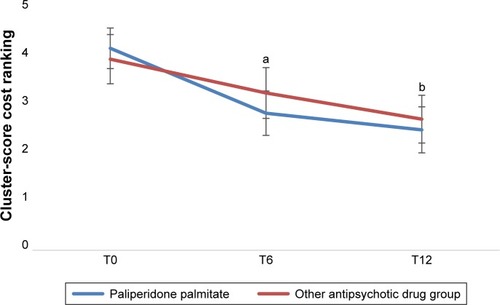
Figure 2 Clustered column chart to compare the least squares mean for the aggregated scores (0–8) of Severe Disturbance for paliperidone palmitate and the other antipsychotic drugs group.
Abbreviations: adj, adjusted; HoNOS, Health of the Nation Outcome Scales; SE, standard error.
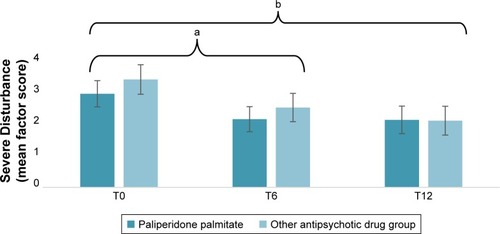
Figure 3 Cox PH regression showing the time to discharge of patients prescribed either PP (n=34) or those in the other antipsychotic drugs group (n=27).
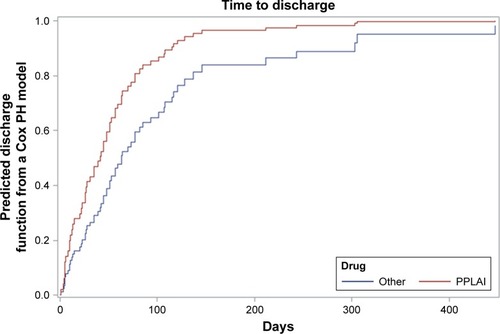
Table S1 Key to MHCT Care clusters 10–17 (“psychosis” super cluster)
Table S2 Key to individual HoNOS items
Table S3 Cluster-score cost ranking according to financial outlay