
Figures & data
Figure 1 Group differences in CBCL (1.5–5 years) dimensions scores.
Notes: Relative to the non-ASD comparison control group, the ASD group had significantly higher scores in the ASP and W dimensions as well as in the DP, IP, and TP dimensions. *p<0.05.
Abbreviations: ASD, autism spectrum disorder; ASP, autism spectrum problems; CBCL, Child Behavior Checklist; DP, depressive problems; IP, internalizing problems; TP, total problems; W, withdrawn.
Abbreviations: ASD, autism spectrum disorder; ASP, autism spectrum problems; CBCL, Child Behavior Checklist; DP, depressive problems; IP, internalizing problems; TP, total problems; W, withdrawn.
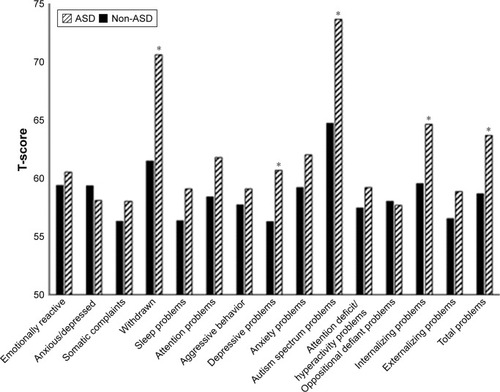
Figure 2 ROC curves for the ASP (A) and W (B) dimensions of the CBCL (1.5–5 years).
Abbreviations: ASP, autism spectrum problems; AUC, area under the curve; CBCL, Child Behavior Checklist; ROC, receiver operating characteristic; W, withdrawn.
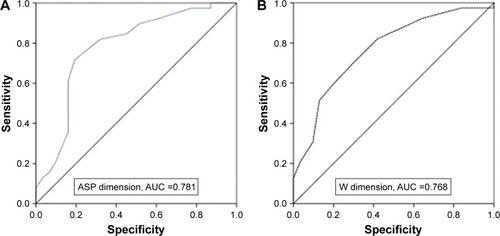
Table 1 ROC analysis of screening ability of the CBCL (1.5–5 years)
Figure 3 Group differences in C-TRF dimensions scores.
Notes: Relative to the non-ASD control group, the ASD group had very significantly higher scores in the ASP and W dimensions as well as significantly higher scores in the ER, AP, IP, and TP dimensions. *p<0.05.
Abbreviations: ASD, autism spectrum disorder; ASP, autism spectrum problems; AP, attention problems; C-TRF, Caregiver-Teacher Report Form; ER, emotionally reactive; IP, internalizing problems; TP, total problems; W, withdrawn.
Abbreviations: ASD, autism spectrum disorder; ASP, autism spectrum problems; AP, attention problems; C-TRF, Caregiver-Teacher Report Form; ER, emotionally reactive; IP, internalizing problems; TP, total problems; W, withdrawn.
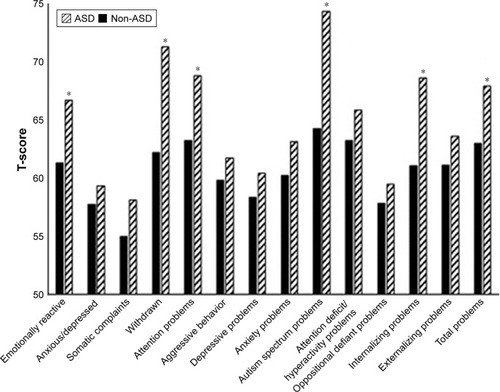
Figure 4 ROC curves for the ASP (A) and W (B) dimensions of the C-TRF.
Abbreviations: ASP, autism spectrum problems; AUC, area under the curve; C-TRF, Caregiver-Teacher Report Form; ROC, receiver operating characteristic; W, withdrawn.
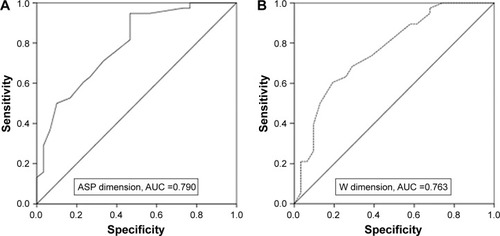
Table 2 ROC analysis for screening ability of the C-TRF