
Figures & data
Figure 1 Illustration of parcellation scheme used for automated hippocampal subfield segmentation: axial view, coronal view, sagittal view. Images are from a control subject.
Abbreviations: CA, cornus ammonis; GC-DG, granule cell layer of dentate gyrus; HATA, the hippocampus–amygdala transition area.
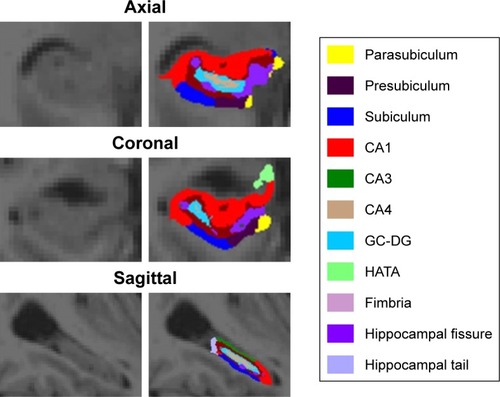
Table 1 Demographic and clinical characteristics of the study participants
Table 2 Relationship between hippocampal subfield volumes and education
Table 3 (A–E) Relationships between cognitive functions and hippocam pal subfield volumes
Table 4 Relationships between cognitive functions and education