
Figures & data
Table 1 Analysis of demographic data and 9 serum indicators in the two groups
Table 2 Variables in logistic regression equation
Figure 1 ROC curve of 3 serum indicators of single detection and combined detection.
Notes: (A) ROC curve of BDNF. (B) ROC curve of IL-1β. (C) ROC curve of cortisol. (D) ROC curve of combined detection.
Abbreviation: ROC, receiver operating characteristic.
Abbreviation: ROC, receiver operating characteristic.
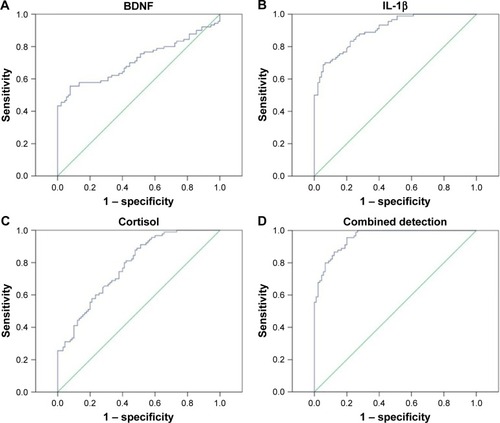
Table 3 Comparison of the sensitivity and specificity and the AUC of single serum marker detection and combined detection
Table 4 Diagnosis accuracy of the combined detection model
Table S1 Detailed list of ELISA kits