Figures & data
Figure 1 Schematic diagram showing progression of 20 subjects from baseline screening.
Abbreviations: Abo-BTX A, abobotulinum toxin A; CDIP-58, Cervical Dystonia Impact Profile-58; SF-36, 36-Item Short Form Health Survey; CES-D, Center for Epidemiologic Studies-Depression.
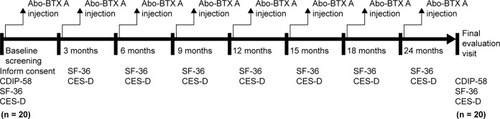
Table 1 Demographic and baseline clinical characteristics of patients with cervical dystonia
Table 2 Clinical score before (week 0) and after (2 years) treatment measured by CDIP-58, SF-36, and CES-D (values are given as mean [SD])
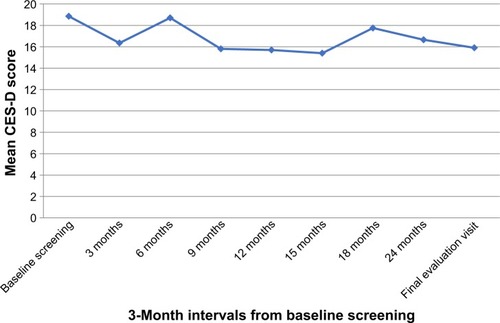
Figure 2 Mean CES-D score assessment at 3-month intervals.
Abbreviation: CES-D, Center for Epidemiologic Studies-Depression.