Figures & data
Figure 1 Flowchart depicting literature search and study selection.
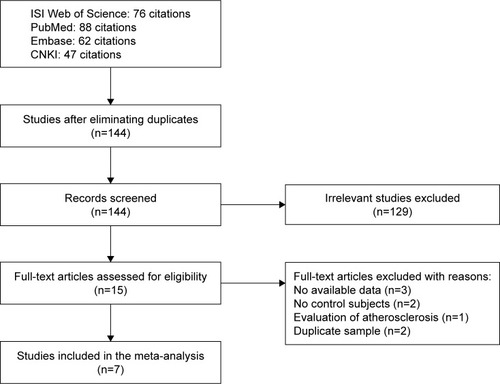
Table 1 Characteristics of individual studies included in the meta-analysis
Table 2 Genotypic and allelic distributions of the MMP-3 polymorphism in ischemic stroke patients and controls
Figure 2 Forest plot for included studies examining the association between rs679620 and ischemic stroke risk under the dominant model (AA + GA vs GG).
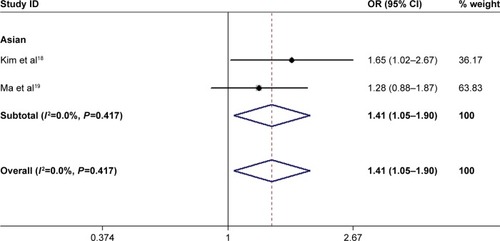
Table 3 Meta-analysis for the association of the MMP-3 polymorphisms rs679620 and rs3025058 with ischemic stroke risk
Figure 3 Forest plot for included studies examining the association between rs3025058 and ischemic stroke risk (5A5A + 6A5A vs 6A6A).
Abbreviation: OR, odds ratio.
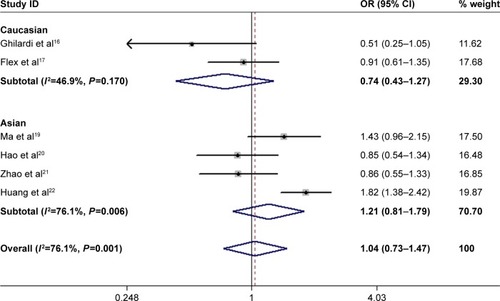
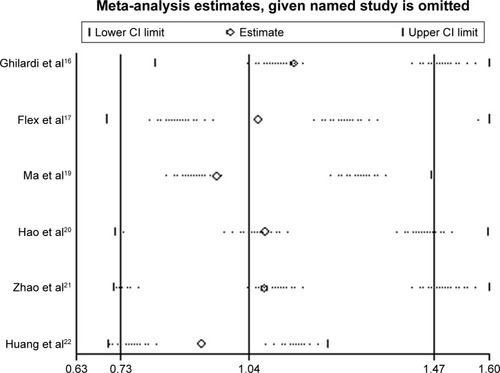
Figure 4 Sensitivity analysis for the association between rs3025058 and ischemic stroke risk (5A5A + 6A5A vs 6A6A).