
Figures & data
Figure 1 Flowchart of study selection.
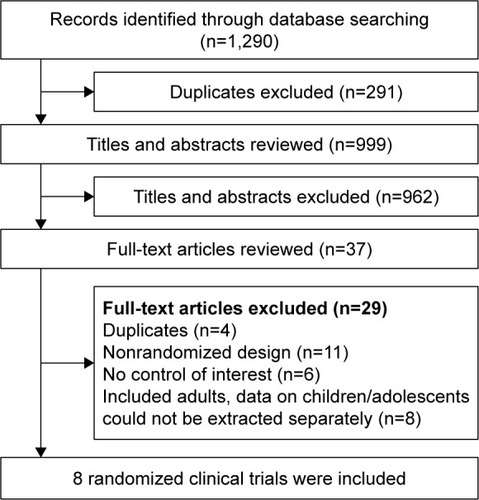
Table 1 Characteristics of included studies
Figure 2 Comparison of bibliotherapy and control conditions for efficacy: change scores in related rating scales.
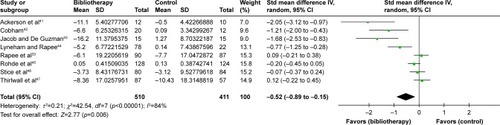
Figure 3 Comparison of bibliotherapy and control conditions for acceptability: all-cause discontinuation from the trials for any reason.
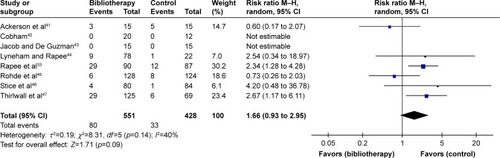
Figure 4 Subgroup analyses of efficacy. (A) Forest plot of SMD for change scores in rating scales for type of disorder. (B) Forest plot of SMD for change scores in rating scales for age. (C) Forest plot of SMD for change scores in rating scales for control conditions. (D) Forest plot of SMD for change scores in depression rating scales for parental involvement.
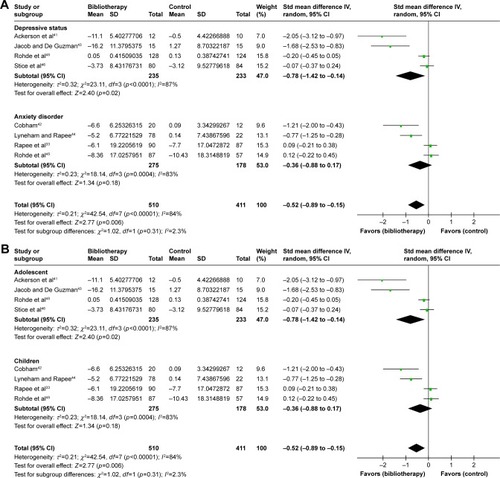
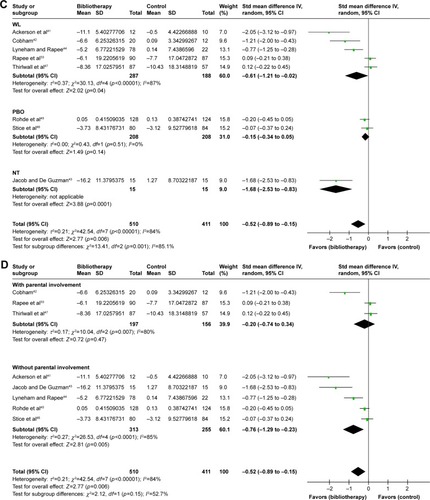
Figure S1 Percentages for assessments of each risk of bias item across all included studies and individual assessments of each risk of bias item for each included study.
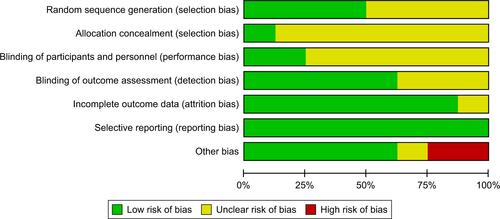
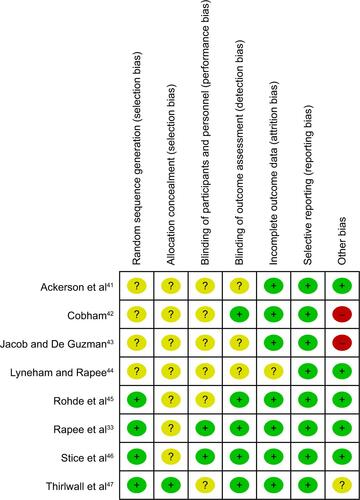
Figure S2 Funnel plot for the efficacy outcome.
Abbreviation: SMD, standardized mean difference.
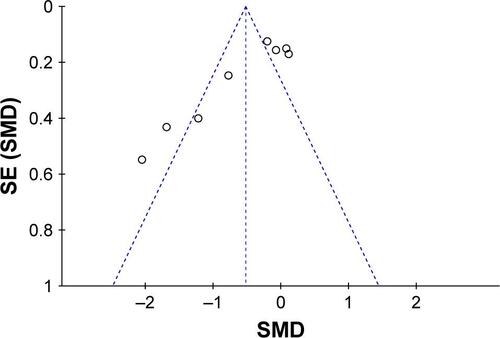
Figure S3 Sensitivity analysis of primary efficacy outcome, excluding a small-sized study (≤50 patients).
Abbreviation: CI, confidence interval.
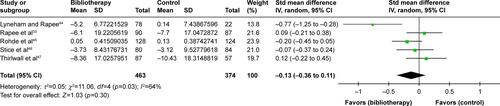
Table S1 Key terms for electronic database search
Table S2 Results of the electronic database search