
Figures & data
Figure 1 Study flow diagram.
Abbreviations: IR, immediate release; CR, controlled release.
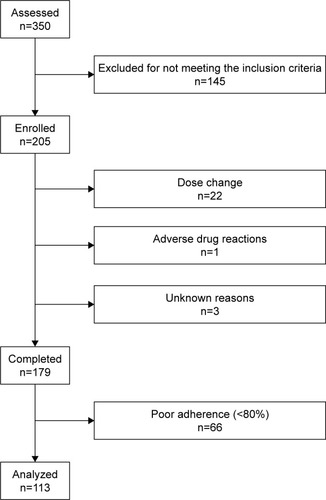
Table 1 Baseline characteristics
Table 2 Changes in depression/anxiety scores (n=113)
Figure 2 Clinical Global Impression – Severity in a dot-plot graph at baseline and at week 8.
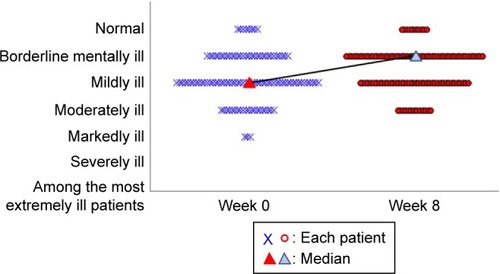
Figure 3 Satisfaction with paroxetine at baseline and week 8 in a dot-plot graph.
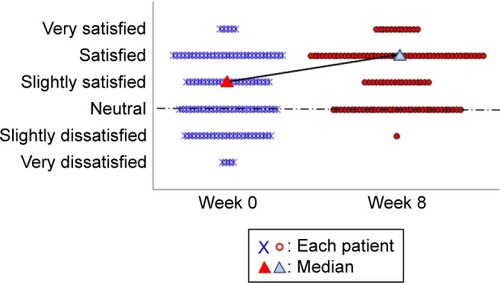
Figure 4 Preference for paroxetine at baseline and week 8 in a dot-plot graph. Notes: The data are in response to the question “Do you prefer the current medication to the previous one”? [img] indicate each patient and [img]n indicate median values at baseline and week 8, respectively. The vertical axis shows the degree of patient satisfaction. No patients were assessed as “much worse” after the treatment change. There was a significant improvement by week 8 (P<0.001; chi-square test) as determined by the change in medians from “slightly better” to “moderately better”.
![Figure 4 Preference for paroxetine at baseline and week 8 in a dot-plot graph. Notes: The data are in response to the question “Do you prefer the current medication to the previous one”? [img] indicate each patient and [img]n indicate median values at baseline and week 8, respectively. The vertical axis shows the degree of patient satisfaction. No patients were assessed as “much worse” after the treatment change. There was a significant improvement by week 8 (P<0.001; chi-square test) as determined by the change in medians from “slightly better” to “moderately better”.](/cms/asset/33ae08a8-7df2-4212-b1ec-3d19cd8b09f1/dndt_a_152985_f0004_c.jpg)
Table S1 Shift of HSDS scores from week 0 to week 8 in PPS (n=113)
Table S2 Baseline characteristics
Table S3 Baseline characteristics
Table S4 Depression/anxiety scores at baseline
Table S5 Depression/anxiety scores at week 8
Table S6 Changes in depression/anxiety scores in ITT (n=150)
Table S7 CGI-S, SSMQ, and MPQ scores at baseline
Table S8 CGI-S, SSMQ, and MPQ scores at week 8
Table S9 Changes of CGI-S, SSMQ, and MPQ scores in ITT (n=151) group