
Figures & data
Figure 1 A comparison of mean SUS scores by quartile, adjective ratings, and the acceptability of the overall SUS score.
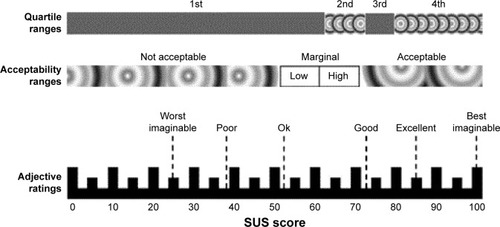
Figure 2 Navigation structure of the system.
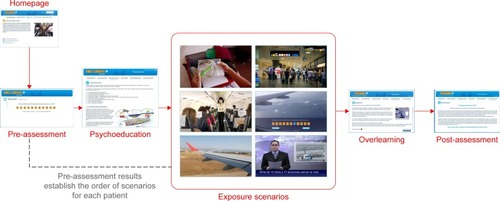
Table 1 Sociodemographic and participant data
Table 2 Expectations and satisfaction scores
Table 3 Opinion interview
Table 4 Usability and Acceptability Questionnaire