Figures & data
Table 1 Demographic characteristics of all participants (n=127)
Table 2 Comparison among the three ASD subgroups (EVENIQ group, discrepantly higher VIQ, and discrepantly higher PIQ) on age, FSIQ, VIQ, PIQ, and motor subtests of the CDIIT
Table 3 Analysis with Bonferroni post hoc comparisons between subgroups including EVENIQ (n=81), discrepantly higher VIQ (n=22), and discrepantly higher PIQ (n=24)
Table 4 Associations between IQ profiles (ie, VIQ, PIQ, and IQD) and motor subtests of CDIIT in all participants
Figure 1 Scatterplot showing the relationship between IQD (PIQ – VIQ) and fine motor subdomain of CDIIT (n=127).
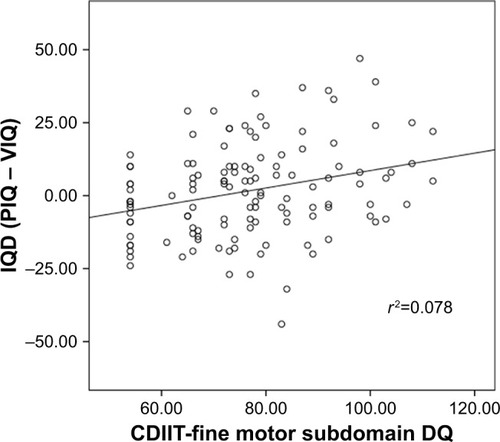
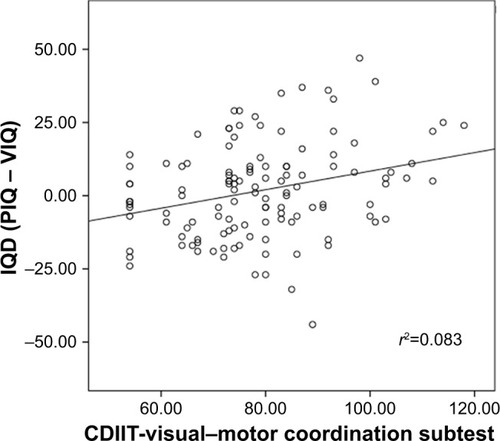
Figure 2 Scatterplot showing the relationship between IQD (PIQ – VIQ) and the visual–motor coordination subtest of the CDIIT (n=127).