Figures & data
Table 1 Patients’ baseline characteristics (safety population)
Figure 1 Mean time to onset (top graphs) and mean duration (bottom graphs) for an “on” state, finger-tapping score improvement, and UPDRS Part III score improvement after single doses of ER CD-LD vs IR CD-LD.a
Notes: *P<0.05, **P<0.01, ***P<0.001 (ANCOVA). aEach analysis includes only the patients who reached each outcome.
Abbreviations: ANCOVA, analysis of covariance; CD-LD, carbidopa-levodopa; ER, extended release; IR, immediate release; SE, standard error; UPDRS, Unified Parkinson’s Disease Rating Scale.
Abbreviations: ANCOVA, analysis of covariance; CD-LD, carbidopa-levodopa; ER, extended release; IR, immediate release; SE, standard error; UPDRS, Unified Parkinson’s Disease Rating Scale.
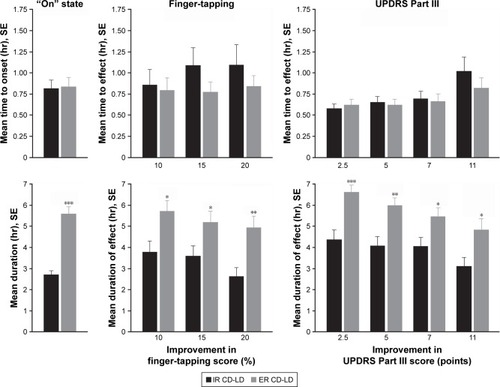
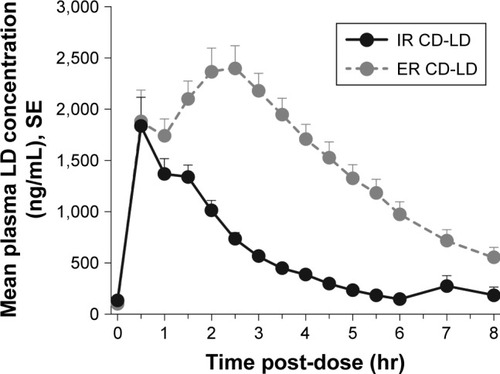
Figure 2 Mean plasma levodopa levels after single doses of ER CD-LD vs IR CD-LD.a
Notes:
aFor each treatment, n=27. However, for six patients who required ER CD-LD redosing and for ten who required IR CD-LD redosing, data are included only until the redosing (see Pharmacokinetic Analyses in the Methods section and Dosing in the Results section).
Abbreviations: CD-LD, carbidopa-levodopa; ER, extended release; IR, immediate release; LD, levodopa; SE, standard error.
Abbreviations: CD-LD, carbidopa-levodopa; ER, extended release; IR, immediate release; LD, levodopa; SE, standard error.