
Figures & data
Figure 1 T-score distribution in male alcoholic patients (n=275). A vertical line shows zero standard deviation. The mean T-score was −0.75±1.36.
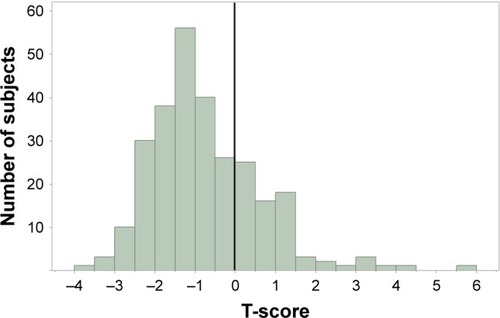
Table 1 Subject characteristics
Table 2 Laboratory marker serum levels of subjects
Figure 2 Receiver operating characteristic curve according to logistic regression analysis.
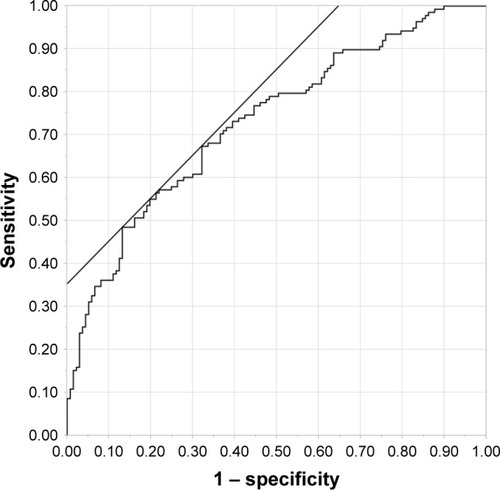
Table 3 Multivariate logistic regression analysis of major factors of low T-score in 275 male subjects
Figure S1 Receiver operating characteristic (ROC) curve of undercarboxylated osteocalcin according to simple logistic regression analysis.
Notes: ROC curve analysis did not discriminate between the normal and low bone mineral density (BMD) groups (area under the curve [AUC]: 0.60, p=0.005, 95% confidence interval: 0.53–0.66) when undercarboxylated osteocalcin (ucOC) was set as a predictor.
![Figure S1 Receiver operating characteristic (ROC) curve of undercarboxylated osteocalcin according to simple logistic regression analysis.Notes: ROC curve analysis did not discriminate between the normal and low bone mineral density (BMD) groups (area under the curve [AUC]: 0.60, p=0.005, 95% confidence interval: 0.53–0.66) when undercarboxylated osteocalcin (ucOC) was set as a predictor.](/cms/asset/ac00aacc-54d2-477f-8d9a-c12b26e49362/dndt_a_153360_sf0001_b.jpg)