
Figures & data
Figure 1 Color preference orders in the HIGH (rhombus, n=70) and LOW (square, n=66) groups.
Notes: *p<0.05 vs HIGH group. HIGH group consisted of participants with higher hypnotic susceptibilities; LOW group consisted of participants with lower hypnotic susceptibilities.
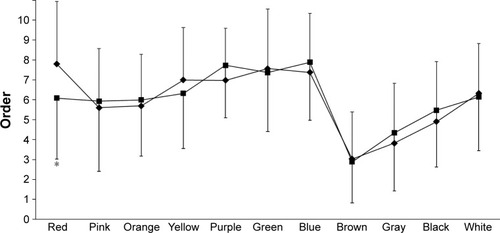
Table 1 Distribution of participants who passed the SHSSC test in the two groups of participants
Table 2 Stepwise multiple regression among color preferences and the SHSSC items in the HIGH (n=70) and LOW (n=66) groups