
Figures & data
Table 1 Baseline characteristics of the studied sample
Table 2 Adjusted OR of depression for 8-OHdG levels in stroke patients
Figure 1 Serum levels of 8-OHdG and CAT in patients with PSD and those without depression.
Abbreviations: 8-OHdG, 8-hydroxy-2′-deoxyguanosine; CAT, catalase; PSD, post-stroke depression.
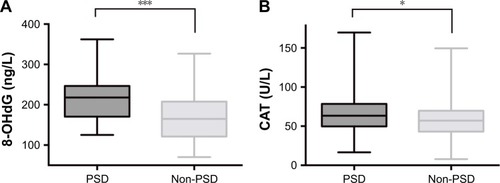
Figure 2 Correlation between CAT and 8-OHdG levels in acute stroke patients or PSD patients.
Abbreviations: 8-OHdG, 8-hydroxy-2′-deoxyguanosine; CAT, catalase; PSD, post-stroke depression.
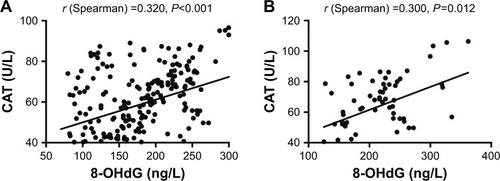
Figure 3 Receiver operator characteristic curve demonstrating sensitivity as a function of 1-specificity for predicting post-stroke depression within 1 month based on the serum 8-OHdG levels in stroke patients.
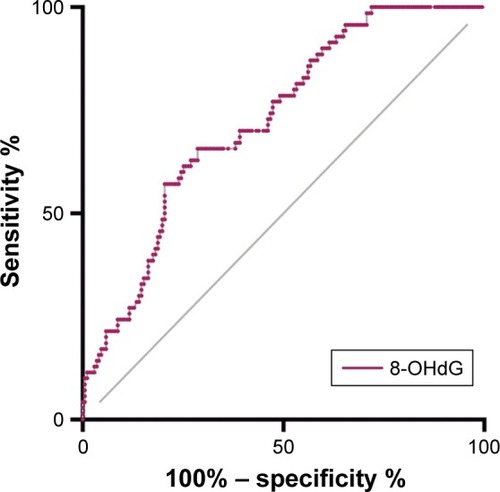
Figure S1 Study flow chart.
Abbreviation: PSD, post-stroke depression.
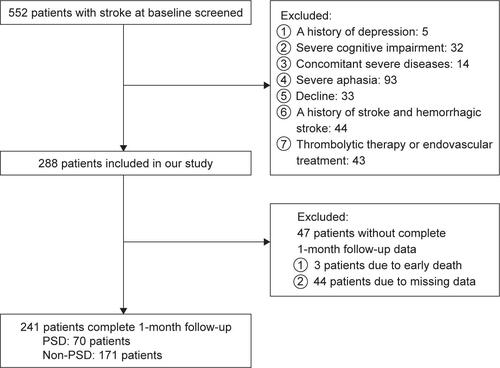
Table S1 Prescribed drugs employed of the studied subjects at admission
Table S2 Serum 8-OHdG and CAT levels according to the severity of stroke and depression
Table S3 Comparisons of serum 8-OHdG and CAT levels in patients with minor stroke and those with moderate-to-severe stroke
Table S4 Correlations between oxidative stress markers and NIHSS scores