Figures & data
Table 1 Demographic and clinical characteristics of the study population
Figure 1 DMN and DAN of remitting-phase RRMS patients (right column) and HCs (left column) (one-sample t-test, p < 0.05, Bonferroni corrected). ICx: independent component x obtained by group ICA.
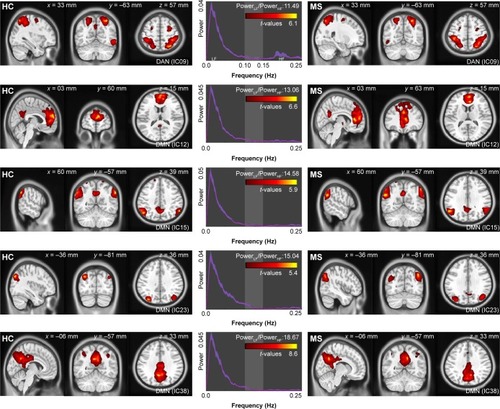
Figure 2 Compared with the HCs, significantly altered FC was observed in the remitting-phase RRMS patients (two-tailed voxel-level, p < 0.01; cluster-level, p < 0.05; GRF corrected).
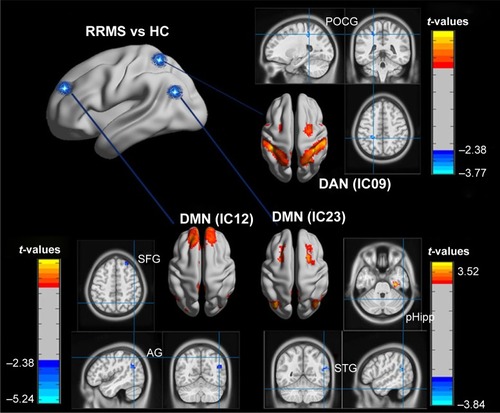
Table 2 Group comparisons of the ICs (subnetworks) of the DAN and DMN between the remitting-phase RRMS patients and the HCs
Figure 3 FNC analysis in the HCs and the remitting-phase RRMS patients.
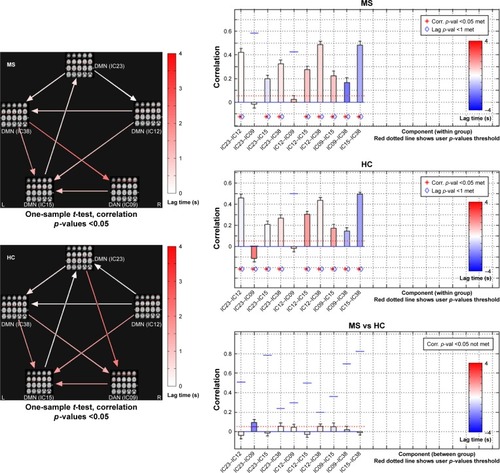
Figure 4 Significant alterations in the GCT in the spectral domain between the HCs and the remitting-phase RRMS patients.
Abbreviations: Corr, correlation; DAN, dorsal attention network; DMN, default mode network; GCT, Granger causality test; HC, healthy control; IC, independent component; MS, multiple sclerosis; RRMS, relapsing-remitting multiple sclerosis; val, value.
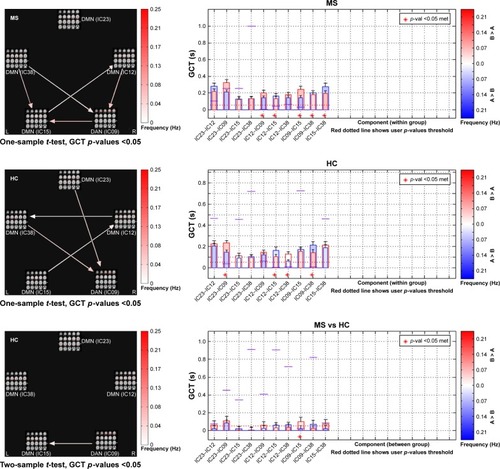
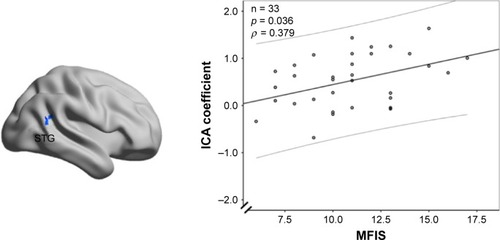
Figure 5 Correlations between the clinical measures (MFIS) and the altered connectivity coefficients of the remitting-phase RRMS patients.